1. Home > 
  2. Stock Photos > 
  3. Data Processing Overlays on Secure Encryption Interface

Data Processing Overlays on Secure Encryption Interface Image

Data Processing Overlays on Secure Encryption Interface

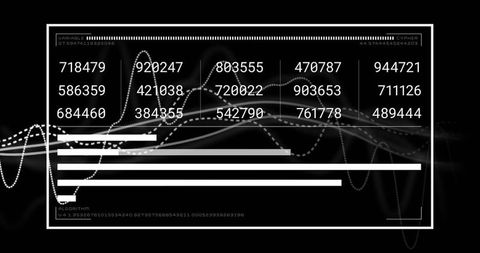
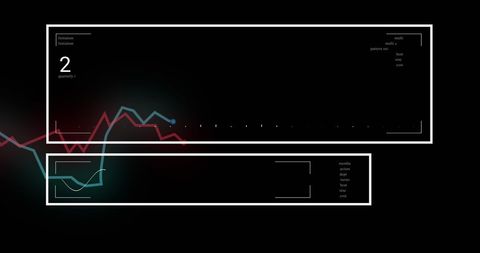
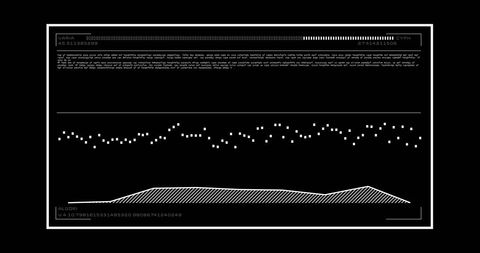
Presents a visual concept highlighting digital data processing with algorithms and secure encryption elements. Ideal for illustrating articles or presentations about technology, business intelligence, or cybersecurity. Useful for conveying complex digital and IT themes and encryption principles.

Powered by Shutterstock logo - Get 15% off with code: PIKWIZARD15
Factory Female Industrial Engineer working with automation robot arms machine in intelligent factory industrial on real time monitoring system software.Digital future manufacture. - Powered by Shutterstock - Get 15% off with code: PIKWIZARD15Data science, business analysis and strategy, big data concept.Business teamwork analyzing financial graph on virtual touch screen, futuristic technology solution for business development - Powered by Shutterstock - Get 15% off with code: PIKWIZARD15Image of data processing over diverse surgeons during operation. Technology, medicine and digital interface concept digitally generated image. - Powered by Shutterstock - Get 15% off with code: PIKWIZARD15Scientist working with business data, finance, marketing report, Big Data Analytics technology, Processing Complexity information flow on virtual screen, machine learning, artificial intelligence, ML - Powered by Shutterstock - Get 15% off with code: PIKWIZARD15Python Programming Web Development Coding Concept.Software development concepts and programming for various devices, Software Engineer Computer programming, coding process, chart, and Data analytics. - Powered by Shutterstock - Get 15% off with code: PIKWIZARD15

Credit Photo

If you would like to credit the Photo, here are some ways you can do so

Free (free of charge)

Free for personal and commercial use.

Author: Creative Art

Similar Free Stock Images

Dynamic Stock Market Concept with Colorful Line Graphs
Premium
Data Science and engineering, digital technology, tech background. Software engineer working with database and big data analytics, cloud computing with AI and data exchange, innovation technology
Dynamic Stock Market Graphs Indicating Financial Trends
Global Financial Data With Blue World Map Overlay
Financial Data Streaming with Arrows Over Graphic Indicators
Financial Data Chart Over City Silhouette
Premium
AI image creation technology. Man use AI software on a laptop to generate images, showcasing a futuristic user interface. screen with visual prompt. Image generated by artificial intelligence. photo,
Digital Data Processing with Scope Scanning Interface
Data Processing Interface on Black Digital Screen
Dynamic Green Stock Chart on Digital Grid Background
Financial Stock Market Data Analysis on Digital Interface
Premium
Man look at the dashboard with graphs and charts. Concept of data management system, business intelligence, data statistics, marketing analysis, key performance indicators (KPI) and analytics.
Digital Data Processing with Graphical Interface
Data Security with Tech Bar Graph Overlay
Analyzing Data Trends on Digital Graph Interface
Retro Video Display with Digital Interference Effect
Premium
Man interacting with a holographic touchscreen interface in red color. Concept of cyber attack, malware, data breach, system hacking, virus, spyware, compromised information and urgent attention.
Financial Data Processing with Rising Graphs
Digital Data Analytics Interface with Graphs and Code
Dynamic Statistical Data Analysis on Digital Grid Network
Financial Data Processing with Graphs and Charts Overlay
Premium
Man using thumb to scan finger print or for digital processing  biometric identification  to access  security system includes internet banking, cloud system and mobile phone , Cyber security concept.
Digital Data Visualization and Analysis Interface
Abstract Digital Stock Market Analysis with Graphs
Dynamic Stock Market Analysis Concept Artwork
Dynamic Financial Data Overlaid on Grid Background
Premium
Portrait of Woman Working on Computer, Typing Lines of Code that Appear on Big Screens Surrounding her in a Monitoring Room. Female Programmer Creating Innovative Software Using AI Data and System
Digital Data Waveform on High-Tech Interface
Dynamic Data Code with Digital Visualization Overlay
Global Financial Data with Dynamic Analytics Visualization
Digital Interface Visualizing DNA and Data Patterns
Vibrant Financial Data Lines on Digital Graph Background
Colorful Stock Market Graph with Data on Grid
Premium
Business developer using Kanban board framework on laptop computer. Agile software development lean project management tool, project management, business development concept
Dynamic Financial Data Graphs Networking in Global Business
Digital Financial Data with Trending Arrows
Financial Graph and Cityscape Analysis with Technological Overlay
World Map with Falling Line Graphs Indicating Global Economic Decline
Premium
Business developer using Kanban board framework on laptop computer. Agile software development lean project management tool for fast changes, project management concept
Financial Data Flow against Urban Skyline Backdrop
Futuristic Digital Interface with Spiraling Coding Patterns
Digital Finance: Modern Stock Market Analysis Display
Analyzing Accelerating Data Trends on Grid with Tech Insights
Premium
cloud technology concept Global network of metaverse systems exchange of information global business Megatrends on the Internet for Telecommunication
Digital Financial Data Analysis with Graphs and Stock Market Trends
Financial Data Processing with Digital Patterns for Global Business
Financial Data Analysis with Code Interface on Black Background
Futuristic Technology Interface with DNA Elements
Premium
Data science. Man programmer using digital tablet computer analyzing and develop software on futuristic virtual interface screen. Algorithm, big data analysis and management, data visualization
Colorful Bar Graph with Data Overlay on Black Background
Dynamic Financial Data Visualization on Digital Grid Background
Holographic Financial Data Visualization with Stock Trends
Dynamic Financial Data Against Urban Skyline
Premium
Image of data processing over caucasian server room worker. Global science, connections, data processing and digital interface concept digitally generated image.
Holographic Financial Stock Market Analysis Visualization
Dynamic Stock Market Data Analysis With Graphs and Percentages
Dynamic Data Graph on Dark Digital Grid Background
Dynamic Stock Market Data Visualization for Financial Analysis
Premium
businessman holding a virtual interface with AI agents icons. automation, smart business solutions, and digital transformation. machine learning, data processing, and artificial intelligence.
Financial Graph with Data Analysis and Market Statistics
Fluctuating Stock Market Graph with Dramatic Peaks
Abstract Digital DNA Helix with Geometric Patterns and Nodes
Dynamic Stock Market Graph with Vibrant Color Lines on Grid
Stock Market Trends Visual with Growth Charts on Black Background
Dynamic Digital Stock Market Ticker with Growing Graph Trends
Premium
Man look at the dashboard with graphs and charts. Concept of data management system, business intelligence, data statistics, marketing analysis, key performance indicators (KPI) and analytics.
Digital Stock Market Trends and Financial Growth Analysis
Dynamic Financial Graphs Over Cityscape Background
Dynamic Digital Data Analysis on Elevated Grid
Futuristic Data Visualization on Black Background
Premium
Data scientists. Man programmer using laptop analyzing and development at various information on futuristic virtual interface screen. Algorithm. marketing and deep learning of artificial intelligence
Dynamic Financial Data Analysis with Virtual Screen
Dynamic Data Analysis Visualization with Colorful Graphs
Financial Data Line Graph on Digital Display
Cybersecurity Interface with Digital Shield Icon Displayed
Premium
Hand touching modern interface digital transformation and metaverse concept. Connection next generation technology and new era of innovation.
Digital Financial Data Analysis with Infographics and Charts
Analyzing Stock Market Data Trends with Futuristic Visuals
Digital Data Visualization with Trend Lines and Percentage Changes
Financial Growth Graph and Data Analytics Representation
Premium
Businessman analyze and visualize complex information on a virtual screen using AI to process data. Big data technology and data science.Data flow.Digital neural network.artificial intelligence
Digital Graph over Stock Market Data Concepts
Data Visualization on Security Shield Interface for Cyber Security
Data Processing Interface with Analytic Visuals on World Map
Dynamic Financial Chart Illustrating Stock Market Volatility
Premium
Businessman using digital tablet with AI icon and data analytics interface. Concept of artificial intelligence, big data, machine learning, innovation and digital transformation in technology business
Analyzing Financial Data on Digital World Map Background
Data Processing with Abstract Graph and Digital Interface
Digital Financial Data Analysis on Grid Framework
Futuristic Data Terminal with Code and Digital Interface Overlay
Premium
Data Processing, digital technology, internet network technology concept. Man computer programmer working on big data and computer code with data center, server room as backgrounds
Digital Financial Data Graph on Black Screen Background
Digital Visualization of Global Networking with Statistical Graphs
Dynamic Financial Data Graph in Digital Grid Display
Dynamic Stock Market Trends with Graphs on Digital Display
Digital Financial Data Interface with Analytics
Digital Data and Arrows Showcasing Market Trends
Premium
Man Use Smartphone Hand,touch screen.Project Manager Researching Process.Business Team Work Startup modern Office.Global Strategy Virtual Icon.Innovation Graphs Interface.Analyze market stock.Blurred
Dynamic Financial Data Visualization over Urban Silhouette
Graphical Analysis on Russian Economy with Financial Metrics
Futuristic Data Visualization Chart with Digital Mountain Peaks
Dynamic Financial Data Streams for Market Analysis
Premium
Man Typing Keyboard Laptop Hand.Project Manager Researching Process.Business Team Working Startup modern Office.Global Strategy Virtual Icon.Innovation Graphs Interfaces.Analyze market stock.Blurred
Fluctuating Digital Stock Market Data Chart
Digital Financial Data Processing Interface on Red Background
Abstract Digital Interface for Medical Data Processing
Abstract Technology with Financial Data and Graphs on Black Background
Premium
Business process and workflow automation with flowchart. Hand holding wooden cog flowing process management on white background
Futuristic DNA Helix with Digital Interface Elements
Data Analysis with Advanced Technology Interface Details Profusion
Cryptocurrency Trends and Data Visualization Concept
Sound Wave Visualization with Programming Code Elements
Premium
Data management, Business developer using Kanban board framework on laptop computer. Agile software development, document, database management concept. Business and technology background
Digital Data Flow with Infographics Hologram
Futuristic Data Processing Interface with Graphs
Digital Chart Display Financial Data Analysis Background Effects
Dynamic Financial Data Graphed Over Digital Grid
Premium
Business project manager using Kanban board framework on laptop computer. Agile software development lean project management tool for fast changes, project management system concept
Digital Financial Data and Stock Market Chart on Dark Interface
Digital Interface Displaying Data Processing and Analytics Visuals
Digital Financial Data Visualization on Dark Screen
Global Cyber Security Data Interface on Dark Background
Premium
Strategic Planning and Analysis in Business Project Management
Digital DNA and Brain Data Interface Display in Dark Theme