- Home >
- Stock Photos >
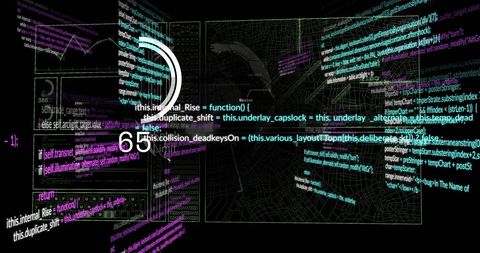
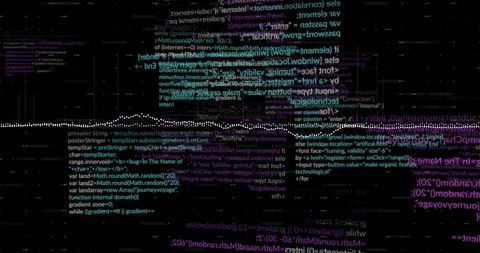
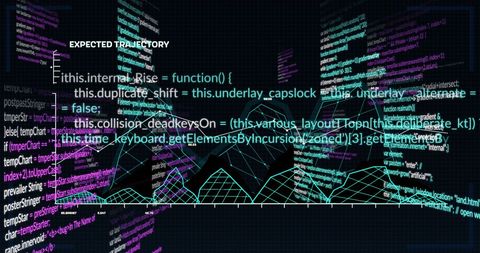
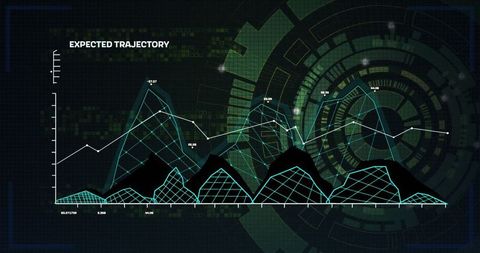
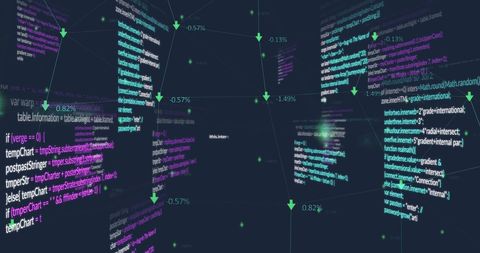
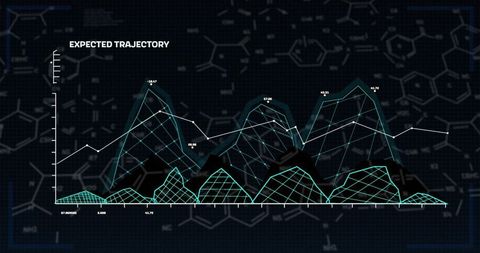
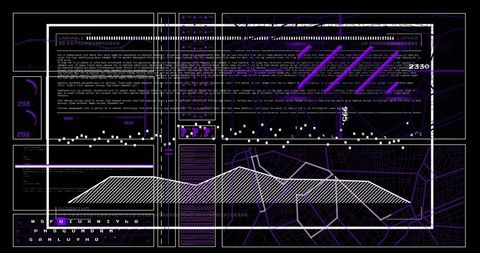
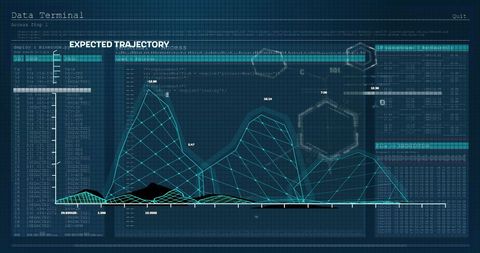
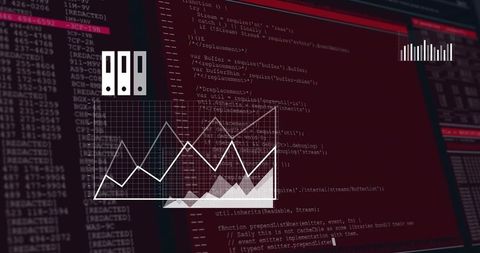
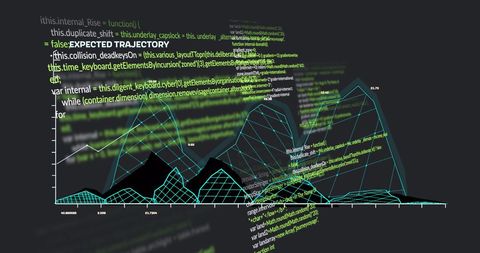
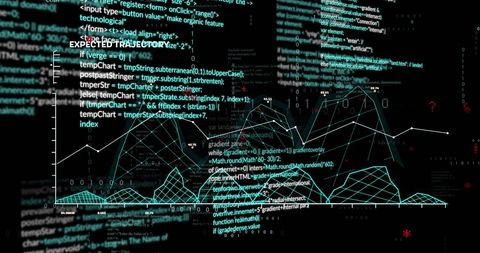
- Data Processing Visual with Graphs and Code Over Black Background
Data Processing Visual with Graphs and Code Over Black Background Image
This digital visual presents a complex mixture of graphs and programming code over a black background, suggesting themes of data analysis and processing. The style fits topics in business tech, financial modeling, and scientific research. It is ideal for use in presentations, articles, or educational materials focused on data science, coding, technology-driven industries, or predictive analytics.

downloads
Tags:
More
Credit Photo
If you would like to credit the Photo, here are some ways you can do so
Text Link
photo Link
<span class="text-link">
<span>
<a target="_blank" href=https://pikwizard.com/photo/data-processing-visual-with-graphs-and-code-over-black-background/4d05c3cbc515a3484a91dcc664c6df49/>PikWizard</a>
</span>
</span>
<span class="image-link">
<span
style="margin: 0 0 20px 0; display: inline-block; vertical-align: middle; width: 100%;"
>
<a
target="_blank"
href="https://pikwizard.com/photo/data-processing-visual-with-graphs-and-code-over-black-background/4d05c3cbc515a3484a91dcc664c6df49/"
style="text-decoration: none; font-size: 10px; margin: 0;"
>
<img src="https://pikwizard.com/pw/medium/4d05c3cbc515a3484a91dcc664c6df49.jpg" style="margin: 0; width: 100%;" alt="" />
<p style="font-size: 12px; margin: 0;">PikWizard</p>
</a>
</span>
</span>
Free (free of charge)
Free for personal and commercial use.
Author: Creative Art