
- Home >
- Free Stock Photos & Images >
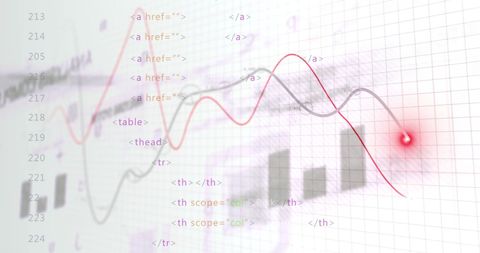
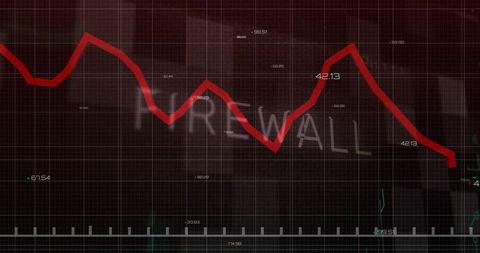
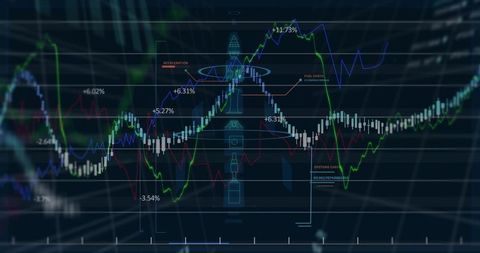
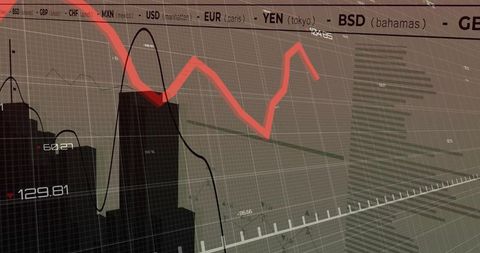
- Data Processing Visualization with Code and Graphs
Data Processing Visualization with Code and Graphs Free Stock Image

This digital artwork blends code elements with a graphical chart and bar graphs on a white backdrop, symbolizing the fusion of data processing and technology in global business contexts. Ideal for use in presentations about digital transformation, programming guides, or technological interfaces, highlighting themes of innovation and analytics.
Powered by  - Get 15% off with code: PIKWIZARD15


downloads
Tags:
More
Credit Photo
If you would like to credit the Photo, here are some ways you can do so
Text Link
photo Link
<span class="text-link">
<span>
<a target="_blank" href=https://pikwizard.com/photo/data-processing-visualization-with-code-and-graphs/930b8f52ffa9f8a97fd3b4fa218f6f8d/>PikWizard</a>
</span>
</span>
<span class="image-link">
<span
style="margin: 0 0 20px 0; display: inline-block; vertical-align: middle; width: 100%;"
>
<a
target="_blank"
href="https://pikwizard.com/photo/data-processing-visualization-with-code-and-graphs/930b8f52ffa9f8a97fd3b4fa218f6f8d/"
style="text-decoration: none; font-size: 10px; margin: 0;"
>
<img src="https://thumbs.wbm.im/pw/medium/930b8f52ffa9f8a97fd3b4fa218f6f8d.jpg" style="margin: 0; width: 100%;" alt="Data Processing Visualization with Code and Graphs" />
<p style="font-size: 12px; margin: 0;">PikWizard</p>
</a>
</span>
</span>
Free (free of charge)
Free for personal and commercial use.
Author: Awesome Content
Similar Free Stock Images


Premium


Premium


Premium


Premium


Premium


Premium


Premium


Premium


Premium


Premium


Premium


Premium


Premium


Premium


Premium


Premium


Premium


Premium


Premium


Premium


Premium


Premium


Premium


Premium


Premium

Explore More Free Stock Images