
- Home >
- Stock Photos >
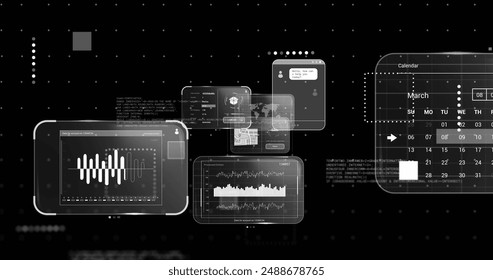
- Data Processing with Abstract Graph and Digital Interface
Data Processing with Abstract Graph and Digital Interface Image

Engage with this visually compelling depiction of data processing and technology themes. Showcasing an abstract digital interface complete with dynamic graphs, this representation is perfect for technology, analytics, and information-focused projects. It illustrates concepts of data analysis, security, and innovation, making it ideal for use in business presentations, infographics, and educational materials exploring digital advancements.
Powered by  - Get 15% off with code: PIKWIZARD15


downloads
Tags:
More
Credit Photo
If you would like to credit the Photo, here are some ways you can do so
Text Link
photo Link
<span class="text-link">
<span>
<a target="_blank" href=https://pikwizard.com/photo/data-processing-with-abstract-graph-and-digital-interface/4badec1204f87ad756a29c237c908089/>PikWizard</a>
</span>
</span>
<span class="image-link">
<span
style="margin: 0 0 20px 0; display: inline-block; vertical-align: middle; width: 100%;"
>
<a
target="_blank"
href="https://pikwizard.com/photo/data-processing-with-abstract-graph-and-digital-interface/4badec1204f87ad756a29c237c908089/"
style="text-decoration: none; font-size: 10px; margin: 0;"
>
<img src="https://pikwizard.com/pw/medium/4badec1204f87ad756a29c237c908089.jpg" style="margin: 0; width: 100%;" alt="" />
<p style="font-size: 12px; margin: 0;">PikWizard</p>
</a>
</span>
</span>
Free (free of charge)
Free for personal and commercial use.
Author: Authentic Images
Similar Free Stock Images

Premium

Premium


Premium


Premium


Premium


Premium


Premium


Premium


Premium


Premium


Premium


Premium


Premium


Premium


Premium


Premium


Premium


Premium


Premium


Premium


Premium


Premium


Premium


Premium


Premium


Explore More Free Stock Images