- Home >
- Stock Photos >
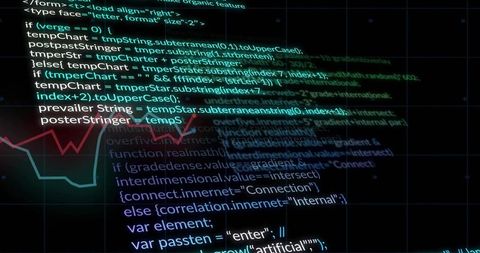
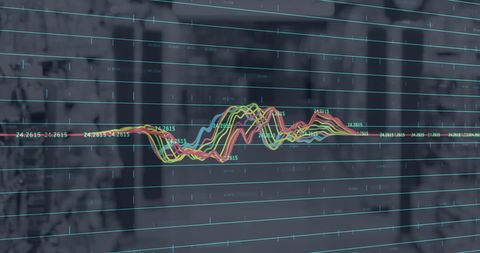
- Data Processing with Digital Interface and Code Background
Data Processing with Digital Interface and Code Background Image

Abstract representation of data processing with visible digital interfaces and code strings layered over a black background. Dynamic waveforms depict analytical processes and technological advancements in programming. Useful for projects relating to technology innovations, software development, and business analytics. Ideal for illustrating concepts in data analysis and network systems.

downloads
Tags:
More
Credit Photo
If you would like to credit the Photo, here are some ways you can do so
Text Link
photo Link
<span class="text-link">
<span>
<a target="_blank" href=https://pikwizard.com/photo/data-processing-with-digital-interface-and-code-background/13df6cbd1e40062a316fca805b780e9a/>PikWizard</a>
</span>
</span>
<span class="image-link">
<span
style="margin: 0 0 20px 0; display: inline-block; vertical-align: middle; width: 100%;"
>
<a
target="_blank"
href="https://pikwizard.com/photo/data-processing-with-digital-interface-and-code-background/13df6cbd1e40062a316fca805b780e9a/"
style="text-decoration: none; font-size: 10px; margin: 0;"
>
<img src="https://pikwizard.com/pw/medium/13df6cbd1e40062a316fca805b780e9a.jpg" style="margin: 0; width: 100%;" alt="" />
<p style="font-size: 12px; margin: 0;">PikWizard</p>
</a>
</span>
</span>
Free (free of charge)
Free for personal and commercial use.
Author: Authentic Images