
- Home >
- Stock Photos >
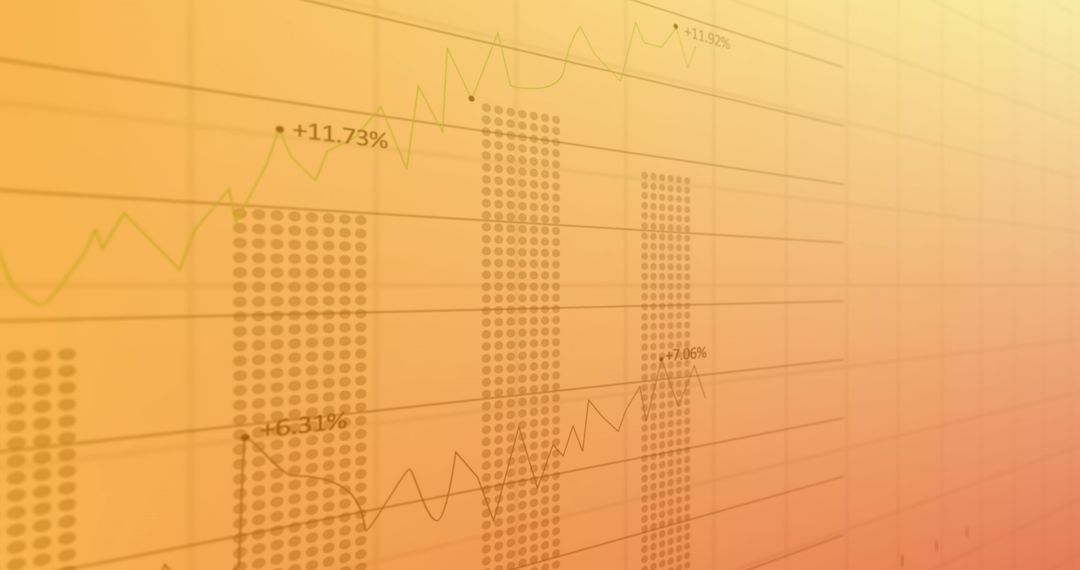
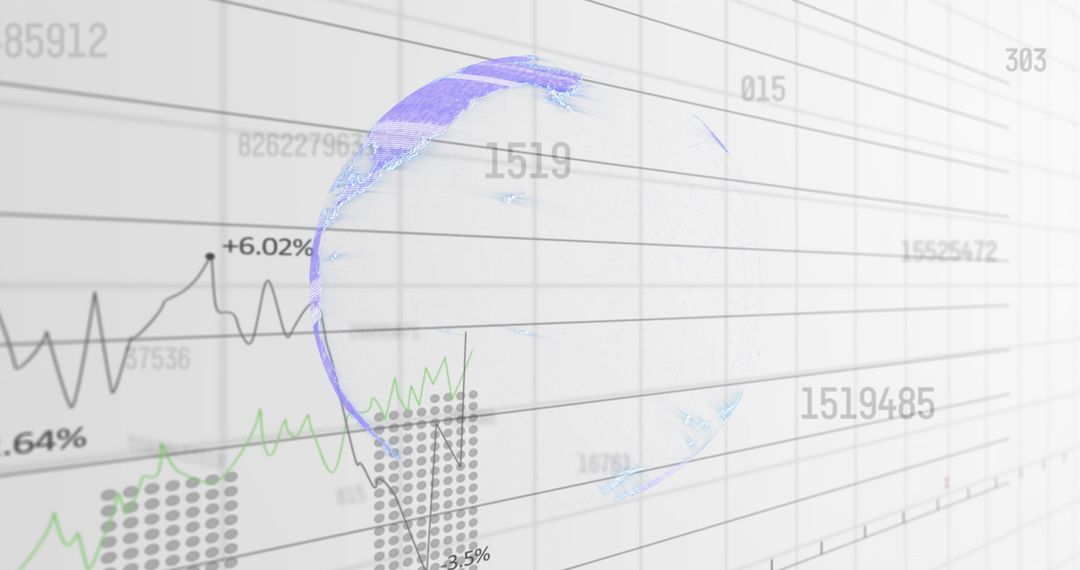
- Data Science Analysis with Financial Graphs and Charts
Data Science Analysis with Financial Graphs and Charts Image

Detailed visual showing data science analysis focusing on financial graphs and charts. Ideal for use in contexts involving stock market studies, business analytics, and global financial trends. Suitable for digital publications about scientific computing, financial technology, or presentations about data predictions.
Powered by  - Get 15% off with code: PIKWIZARD15


2
downloads
downloads
Tags:
More
Credit Photo
If you would like to credit the Photo, here are some ways you can do so
Text Link
photo Link
<span class="text-link">
<span>
<a target="_blank" href=https://pikwizard.com/photo/data-science-analysis-with-financial-graphs-and-charts/a6a195337dfca561cea9b157986e0090/>PikWizard</a>
</span>
</span>
<span class="image-link">
<span
style="margin: 0 0 20px 0; display: inline-block; vertical-align: middle; width: 100%;"
>
<a
target="_blank"
href="https://pikwizard.com/photo/data-science-analysis-with-financial-graphs-and-charts/a6a195337dfca561cea9b157986e0090/"
style="text-decoration: none; font-size: 10px; margin: 0;"
>
<img src="https://pikwizard.com/pw/medium/a6a195337dfca561cea9b157986e0090.jpg" style="margin: 0; width: 100%;" alt="" />
<p style="font-size: 12px; margin: 0;">PikWizard</p>
</a>
</span>
</span>
Free (free of charge)
Free for personal and commercial use.
Author: Creative Art
Similar Free Stock Images

Premium


Premium


Premium


Premium


Premium


Premium


Premium


Premium


Premium


Premium


Premium


Premium


Premium


Premium


Premium


Premium


Premium


Premium


Premium


Premium


Premium


Premium


Premium


Premium

