- Home >
- Stock Photos >
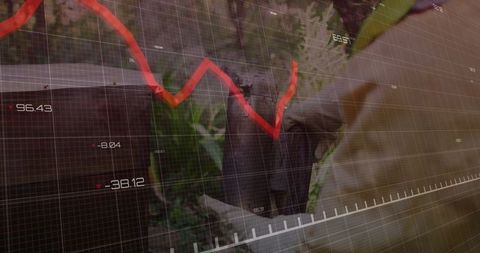
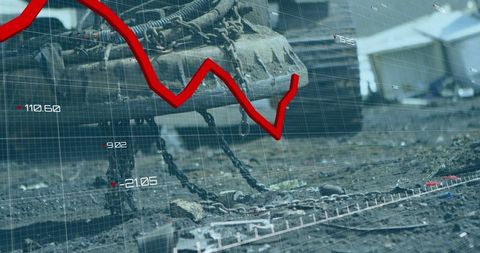
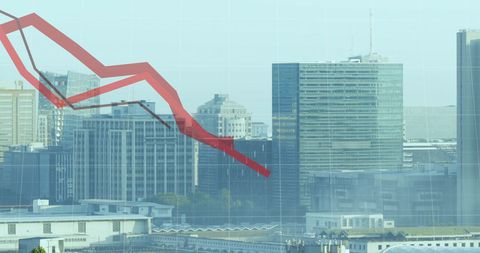
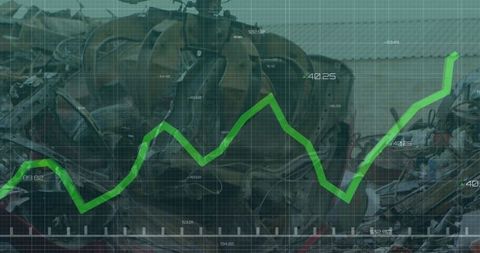
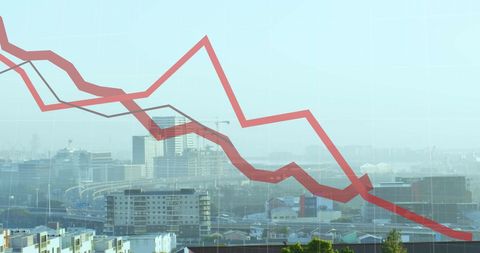
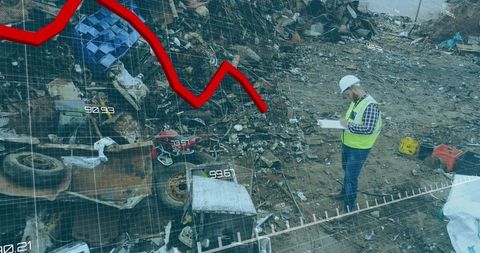
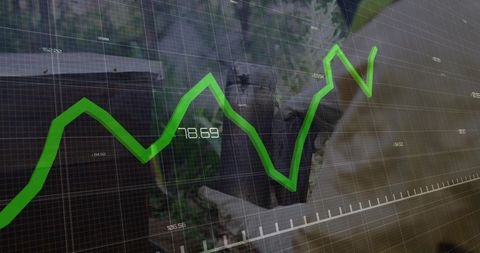
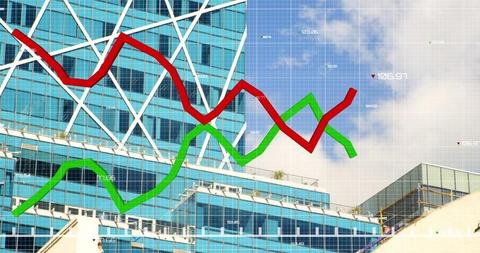
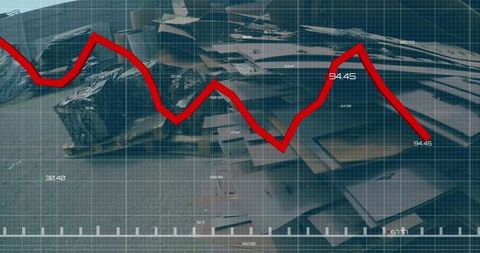
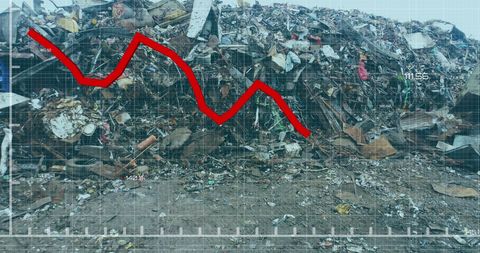
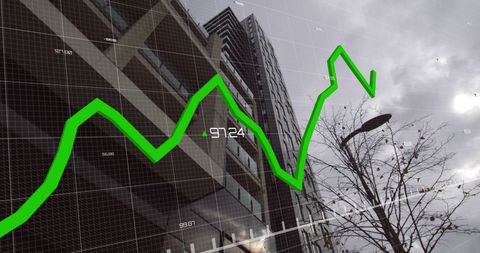
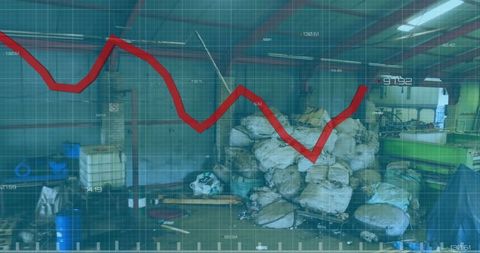
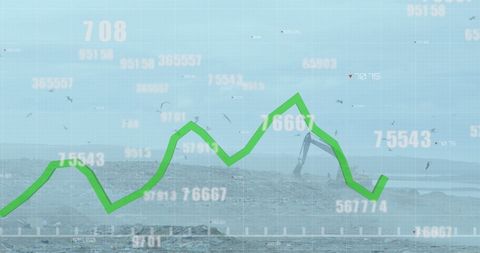
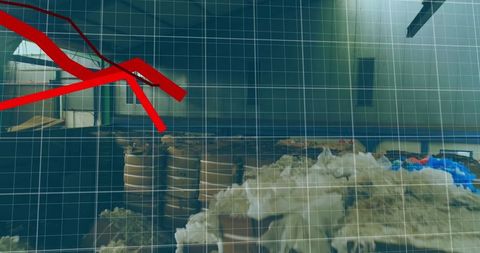
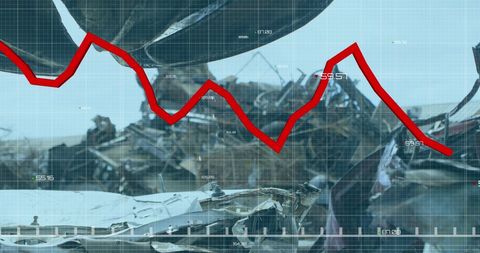
- Data Statistics and Construction Site Overlaid with Graph
Data Statistics and Construction Site Overlaid with Graph Image
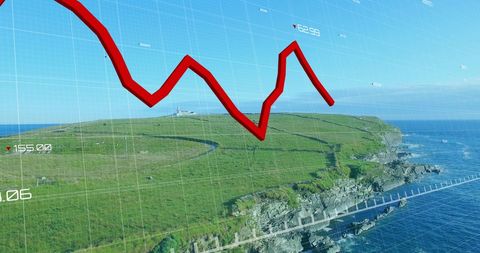
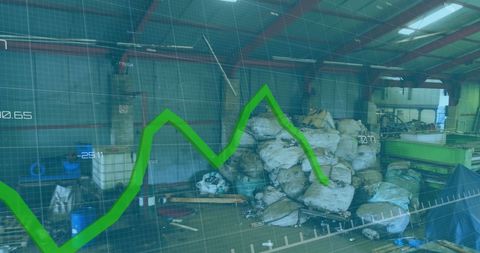
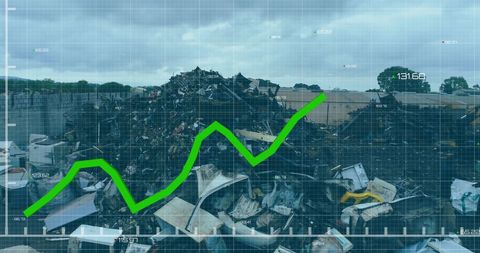
The composite scene merges statistical graph lines with an industrial construction backdrop, prominently featuring construction equipment in a junkyard setting. This image can be utilized in business presentations reflecting economic trends or industrial analyses. It is ideal for contexts involving recycling, data interpretation, global business strategies, or economic downturn discussions, where visualization of data within an industrial framework is crucial.

downloads
Tags:
More
Credit Photo
If you would like to credit the Photo, here are some ways you can do so
Text Link
photo Link
<span class="text-link">
<span>
<a target="_blank" href=https://pikwizard.com/photo/data-statistics-and-construction-site-overlaid-with-graph/d9dcb5be1fa48d332ec38e73f5f53ba5/>PikWizard</a>
</span>
</span>
<span class="image-link">
<span
style="margin: 0 0 20px 0; display: inline-block; vertical-align: middle; width: 100%;"
>
<a
target="_blank"
href="https://pikwizard.com/photo/data-statistics-and-construction-site-overlaid-with-graph/d9dcb5be1fa48d332ec38e73f5f53ba5/"
style="text-decoration: none; font-size: 10px; margin: 0;"
>
<img src="https://pikwizard.com/pw/medium/d9dcb5be1fa48d332ec38e73f5f53ba5.jpg" style="margin: 0; width: 100%;" alt="" />
<p style="font-size: 12px; margin: 0;">PikWizard</p>
</a>
</span>
</span>
Free (free of charge)
Free for personal and commercial use.
Author: Authentic Images