
- Home >
- Stock Photos >
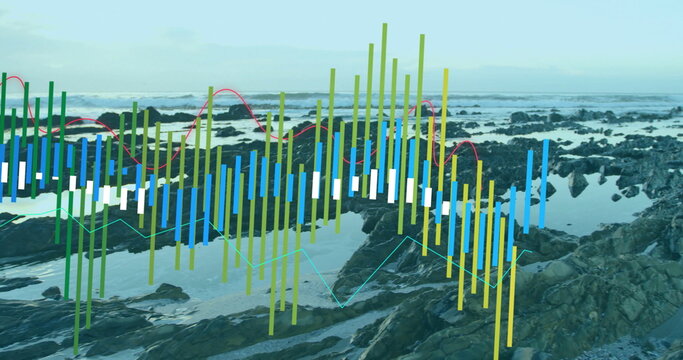
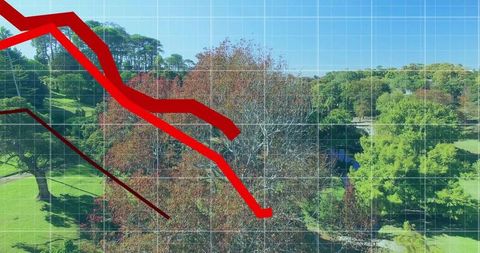
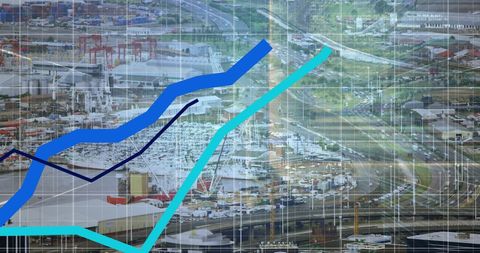
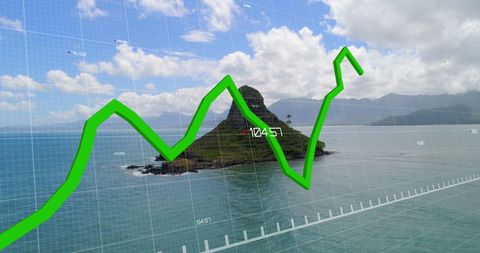
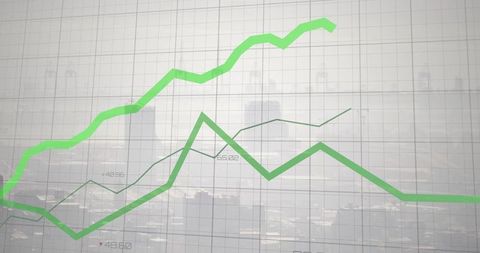
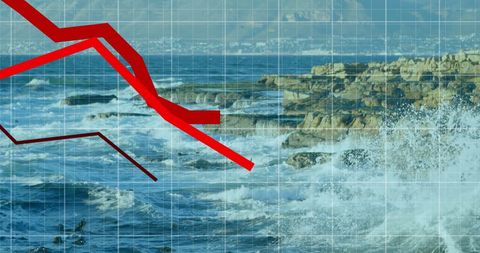
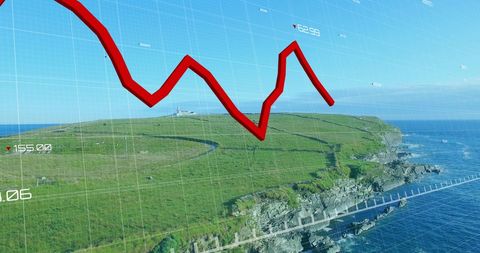
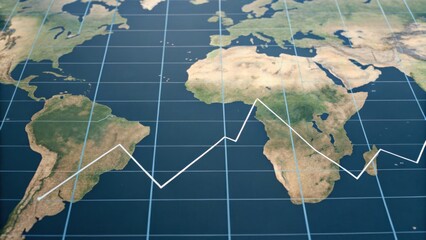
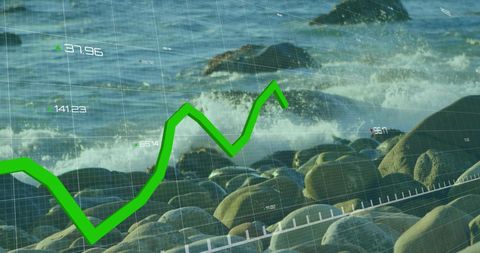
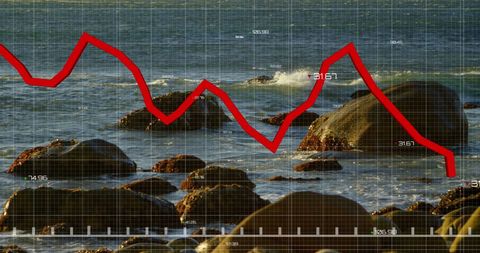
- Data Trend Lines Over Oceanic Minimalistic Visualization
Data Trend Lines Over Oceanic Minimalistic Visualization Image

Visual blends charting elements with natural scenes, merging data analytics with environmental focus. Useful for technology, environmental reports, or businesses exploring data trends. Provides inspiration for analytics-driven outdoor campaigns.
Powered by 


downloads
Tags:
More
Credit Photo
If you would like to credit the Photo, here are some ways you can do so
Text Link
photo Link
<span class="text-link">
<span>
<a target="_blank" href=https://pikwizard.com/photo/data-trend-lines-over-oceanic-minimalistic-visualization/1752f7ece3e0a2c8d942be049abc77a3/>PikWizard</a>
</span>
</span>
<span class="image-link">
<span
style="margin: 0 0 20px 0; display: inline-block; vertical-align: middle; width: 100%;"
>
<a
target="_blank"
href="https://pikwizard.com/photo/data-trend-lines-over-oceanic-minimalistic-visualization/1752f7ece3e0a2c8d942be049abc77a3/"
style="text-decoration: none; font-size: 10px; margin: 0;"
>
<img src="https://pikwizard.com/pw/medium/1752f7ece3e0a2c8d942be049abc77a3.jpg" style="margin: 0; width: 100%;" alt="" />
<p style="font-size: 12px; margin: 0;">PikWizard</p>
</a>
</span>
</span>
Free (free of charge)
Free for personal and commercial use.
Author: Awesome Content
Similar Free Stock Images

Premium


Premium


Premium

Premium


Premium


Premium


Premium


Premium


Premium

Premium


Premium


Premium


Premium


Premium


Premium

Premium


Premium


Premium


Premium


Premium


Premium

Premium

Premium


Premium


Premium


Explore More Free Stock Images