
- Home >
- Stock Photos >
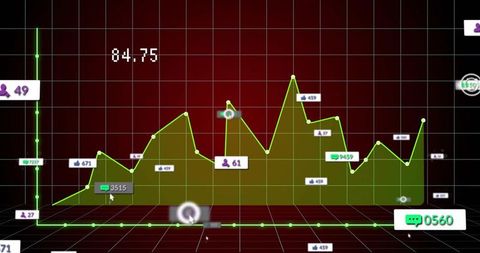
- Data Visualization Analytics with Line Graph and Metrics Feedback
Data Visualization Analytics with Line Graph and Metrics Feedback Image

Engaging visual representation showcases digital analytics in a futuristic blue grid interface, featuring a fluctuating line graph indicative of dynamic user engagement metrics. Ideal for illustrating technology advancements in data analysis, performance tracking, business presentations or educational contexts that focus on interpreting trends and data visualization techniques. The balance of numerical data, such as percentage and analytics markers, with digital aesthetics is particularly useful for specializing in content on artificial intelligence, tech innovation or user experience discussions.
Powered by  - Get 15% off with code: PIKWIZARD15


downloads
Tags:
More
Credit Photo
If you would like to credit the Photo, here are some ways you can do so
Text Link
photo Link
<span class="text-link">
<span>
<a target="_blank" href=https://pikwizard.com/photo/data-visualization-analytics-with-line-graph-and-metrics-feedback/37f7b658c6dc209f19e71557e3d0b09f/>PikWizard</a>
</span>
</span>
<span class="image-link">
<span
style="margin: 0 0 20px 0; display: inline-block; vertical-align: middle; width: 100%;"
>
<a
target="_blank"
href="https://pikwizard.com/photo/data-visualization-analytics-with-line-graph-and-metrics-feedback/37f7b658c6dc209f19e71557e3d0b09f/"
style="text-decoration: none; font-size: 10px; margin: 0;"
>
<img src="https://pikwizard.com/pw/medium/37f7b658c6dc209f19e71557e3d0b09f.jpg" style="margin: 0; width: 100%;" alt="" />
<p style="font-size: 12px; margin: 0;">PikWizard</p>
</a>
</span>
</span>
Free (free of charge)
Free for personal and commercial use.
Author: Authentic Images
Similar Free Stock Images

Premium


Premium

Premium


Premium


Premium


Premium


Premium


Premium

Premium

Premium
Premium


Premium


Premium


Premium


Premium


Premium


Premium


Premium


Premium


Premium


Premium

Premium


Premium


Premium


Premium


Explore More Free Stock Images