- Home >
- Stock Photos >
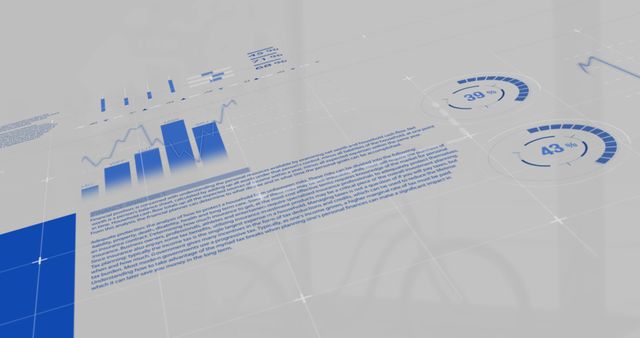
- Data Visualization and Analytics Interface in Blue
Data Visualization and Analytics Interface in Blue Image

Data visualization displaying a series of blue charts and graphs, including line graphs, bar charts, and percentage circles, set against a white backdrop. Ideal for presentations, business reports, or illustrating concepts in digital transformation, analytics, and business intelligence.

downloads
Tags:
More
Credit Photo
If you would like to credit the Photo, here are some ways you can do so
Text Link
photo Link
<span class="text-link">
<span>
<a target="_blank" href=https://pikwizard.com/photo/data-visualization-and-analytics-interface-in-blue/ba33bf303c0d6aa86c5601e43e94da8e/>PikWizard</a>
</span>
</span>
<span class="image-link">
<span
style="margin: 0 0 20px 0; display: inline-block; vertical-align: middle; width: 100%;"
>
<a
target="_blank"
href="https://pikwizard.com/photo/data-visualization-and-analytics-interface-in-blue/ba33bf303c0d6aa86c5601e43e94da8e/"
style="text-decoration: none; font-size: 10px; margin: 0;"
>
<img src="https://pikwizard.com/pw/medium/ba33bf303c0d6aa86c5601e43e94da8e.jpg" style="margin: 0; width: 100%;" alt="" />
<p style="font-size: 12px; margin: 0;">PikWizard</p>
</a>
</span>
</span>
Free (free of charge)
Free for personal and commercial use.
Author: Creative Art