- Home >
- Stock Photos >
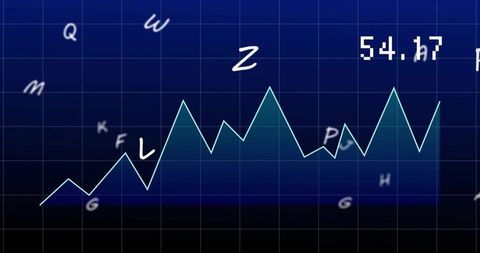
- Data Visualization and Digital Interface Expected Growth
Data Visualization and Digital Interface Expected Growth Image
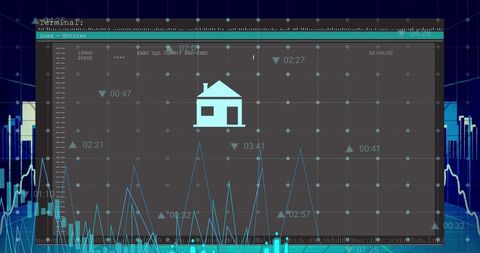
Technological and futuristic projection over digital interface suggests themes of data processing and diagnostics. Useful for presentations on technological advancements, data analysis, and business growth for companies in the digital sector.

downloads
Tags:
More
Credit Photo
If you would like to credit the Photo, here are some ways you can do so
Text Link
photo Link
<span class="text-link">
<span>
<a target="_blank" href=https://pikwizard.com/photo/data-visualization-and-digital-interface-expected-growth/69e31237a6cdfee9bd566fad6965b9c9/>PikWizard</a>
</span>
</span>
<span class="image-link">
<span
style="margin: 0 0 20px 0; display: inline-block; vertical-align: middle; width: 100%;"
>
<a
target="_blank"
href="https://pikwizard.com/photo/data-visualization-and-digital-interface-expected-growth/69e31237a6cdfee9bd566fad6965b9c9/"
style="text-decoration: none; font-size: 10px; margin: 0;"
>
<img src="https://pikwizard.com/pw/medium/69e31237a6cdfee9bd566fad6965b9c9.jpg" style="margin: 0; width: 100%;" alt="" />
<p style="font-size: 12px; margin: 0;">PikWizard</p>
</a>
</span>
</span>
Free (free of charge)
Free for personal and commercial use.
Author: People Creations