
- Home >
- Stock Photos >
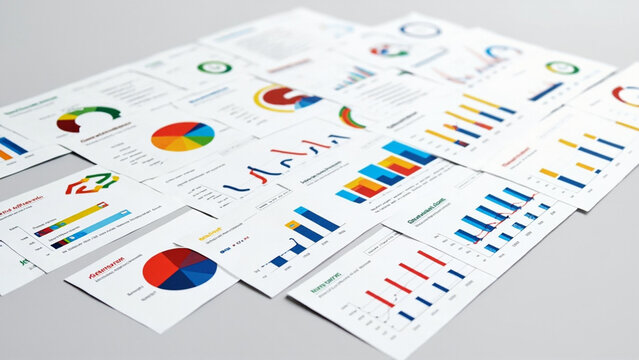
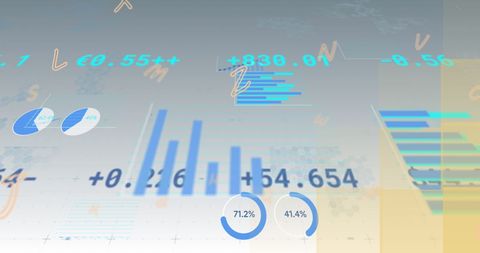
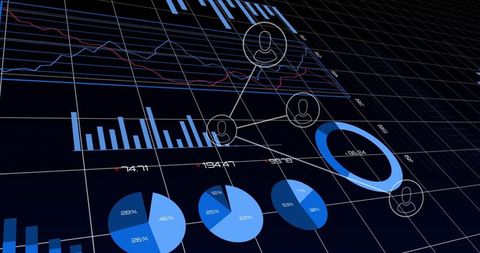
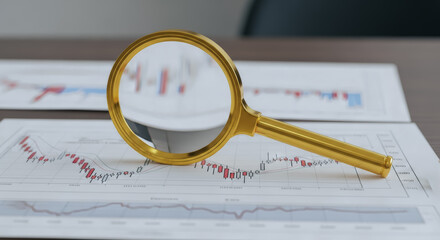
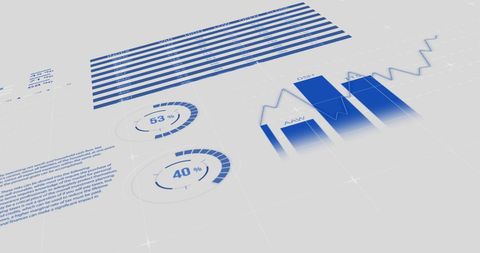
- Data Visualization: Charts and Graphs for Financial Analysis
Data Visualization: Charts and Graphs for Financial Analysis Image

Graphs and charts showcasing financial data illustrate trends and analytics for business presentations. Perfect for financial reports, economic studies, and market industry publications. Ideal for integrating into digital content on data sciences, quantitative analysis training material, or finance-driven projects to make complex data more accessible.
Powered by 


downloads
Tags:
More
Credit Photo
If you would like to credit the Photo, here are some ways you can do so
Text Link
photo Link
<span class="text-link">
<span>
<a target="_blank" href=https://pikwizard.com/photo/data-visualization-charts-and-graphs-for-financial-analysis/ec9398cf23761aa012a6a871c205f414/>PikWizard</a>
</span>
</span>
<span class="image-link">
<span
style="margin: 0 0 20px 0; display: inline-block; vertical-align: middle; width: 100%;"
>
<a
target="_blank"
href="https://pikwizard.com/photo/data-visualization-charts-and-graphs-for-financial-analysis/ec9398cf23761aa012a6a871c205f414/"
style="text-decoration: none; font-size: 10px; margin: 0;"
>
<img src="https://pikwizard.com/pw/medium/ec9398cf23761aa012a6a871c205f414.jpg" style="margin: 0; width: 100%;" alt="" />
<p style="font-size: 12px; margin: 0;">PikWizard</p>
</a>
</span>
</span>
Free (free of charge)
Free for personal and commercial use.
Author: Creative Art
Similar Free Stock Images
Premium


Premium


Premium


Premium

Premium


Premium


Premium

Premium


Premium


Premium


Premium


Premium


Premium


Premium


Premium


Premium


Premium


Premium


Premium

Premium


Premium


Premium

Premium


Premium


Premium


Explore More Free Stock Images