
- Home >
- Stock Photos >
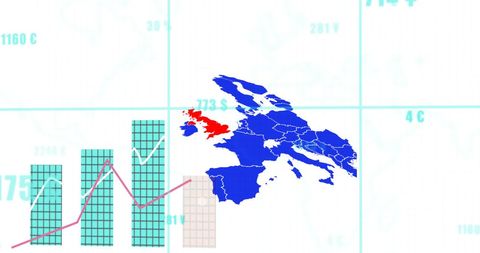
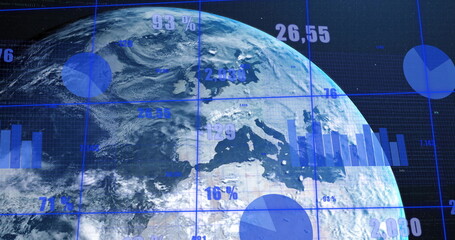
- Data Visualization Concept with Europe Map and Graphs
Data Visualization Concept with Europe Map and Graphs Image
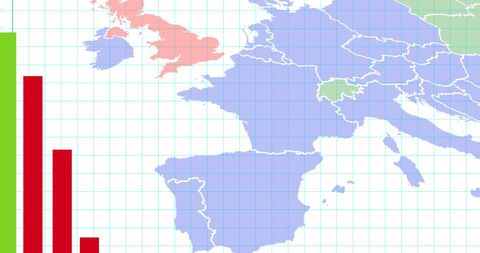
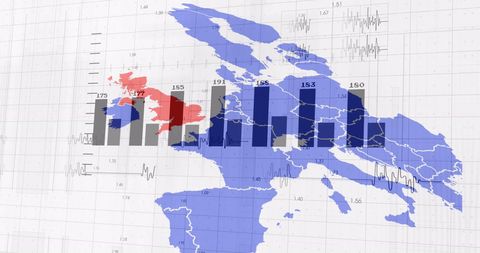
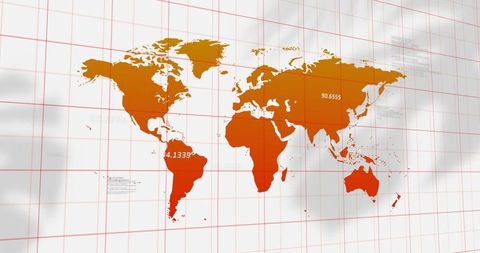
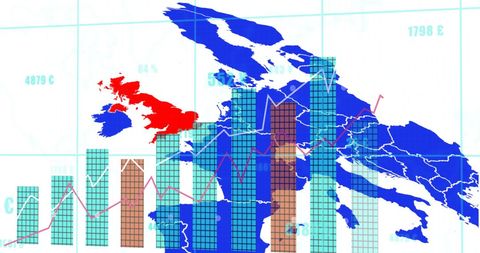
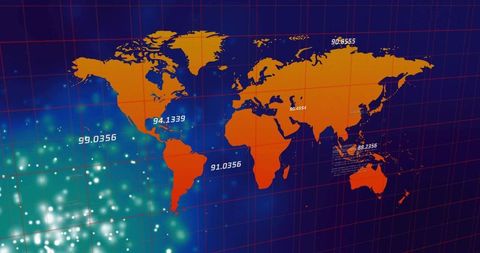
Stylized image featuring a map of Europe with superimposed bar graphs, suggesting the theme of data analysis or international politics. This graphic can serve as a conceptual illustration for articles or materials discussing geopolitics, economics, or data science innovations related to European countries. Useful for professionals delivering presentations or creating content on analytical or political themes within digital landscapes.
Powered by 


downloads
Tags:
More
Credit Photo
If you would like to credit the Photo, here are some ways you can do so
Text Link
photo Link
<span class="text-link">
<span>
<a target="_blank" href=https://pikwizard.com/photo/data-visualization-concept-with-europe-map-and-graphs/2b77f03cdb12d022a03f7b36ca0220e7/>PikWizard</a>
</span>
</span>
<span class="image-link">
<span
style="margin: 0 0 20px 0; display: inline-block; vertical-align: middle; width: 100%;"
>
<a
target="_blank"
href="https://pikwizard.com/photo/data-visualization-concept-with-europe-map-and-graphs/2b77f03cdb12d022a03f7b36ca0220e7/"
style="text-decoration: none; font-size: 10px; margin: 0;"
>
<img src="https://pikwizard.com/pw/medium/2b77f03cdb12d022a03f7b36ca0220e7.jpg" style="margin: 0; width: 100%;" alt="" />
<p style="font-size: 12px; margin: 0;">PikWizard</p>
</a>
</span>
</span>
Free (free of charge)
Free for personal and commercial use.
Author: Awesome Content
Similar Free Stock Images

Premium


Premium

Premium

Premium


Premium


Premium


Premium
Premium
Premium


Premium


Premium


Explore More Free Stock Images