1. Home > 
  2. Stock Photos > 
  3. Data Visualization Dashboard with Eco-Friendly Themes and Progress Indicators

Data Visualization Dashboard with Eco-Friendly Themes and Progress Indicators Image

Data Visualization Dashboard with Eco-Friendly Themes and Progress Indicators

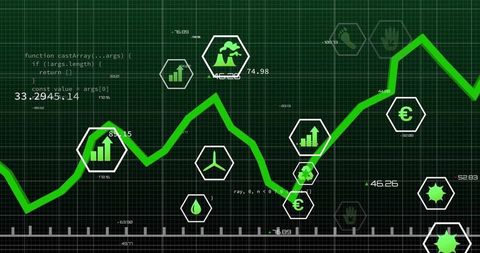
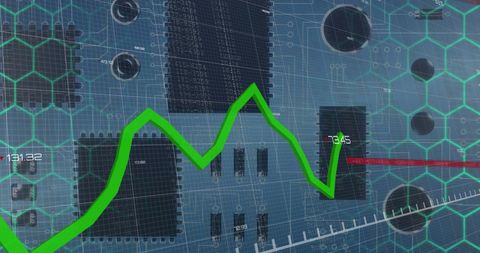
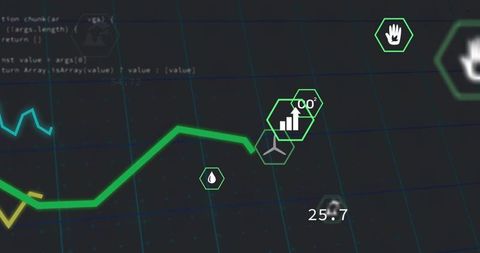
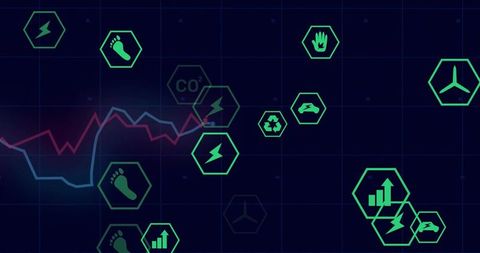
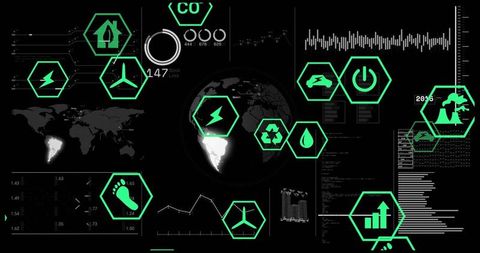
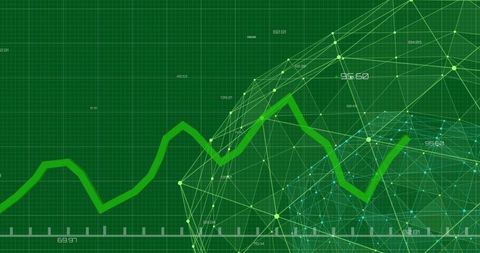
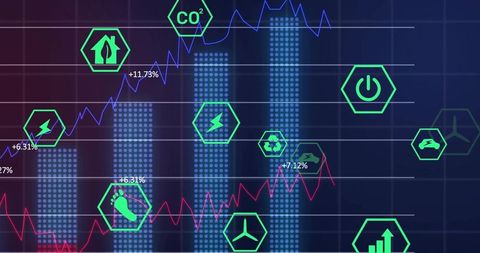
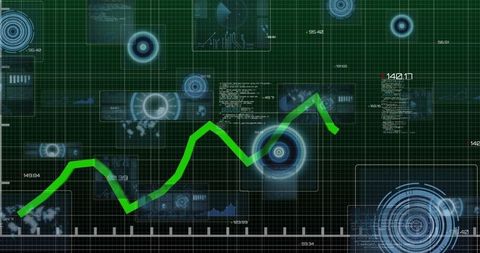
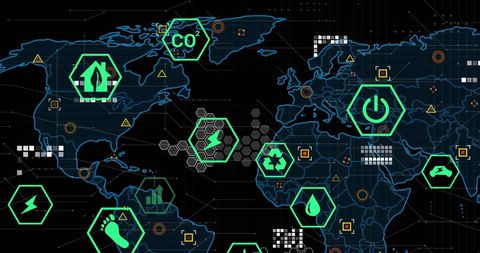
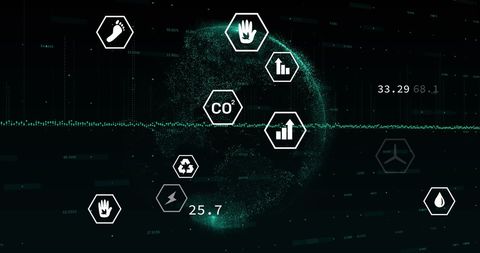
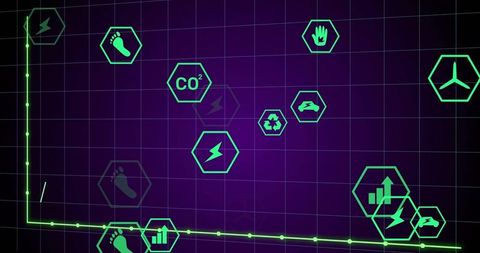
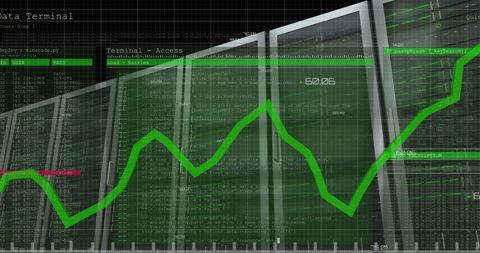
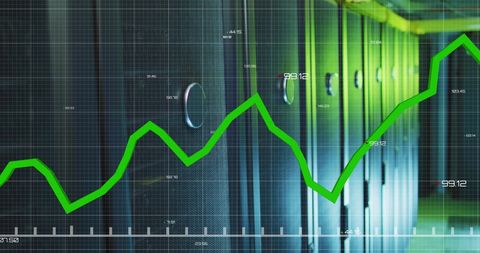
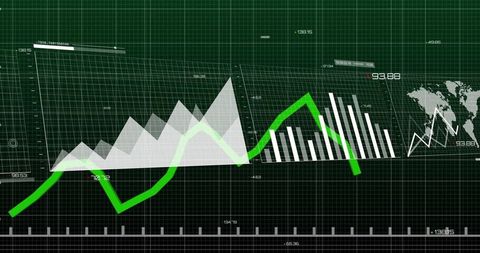
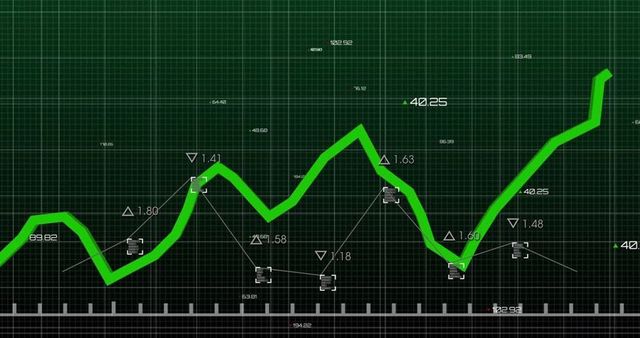
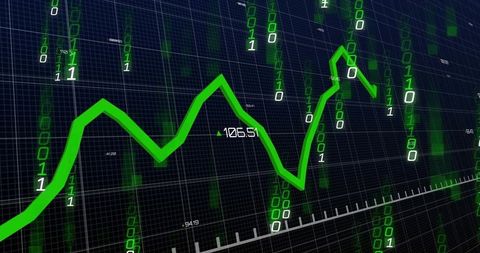
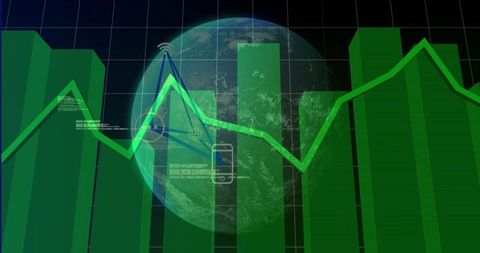
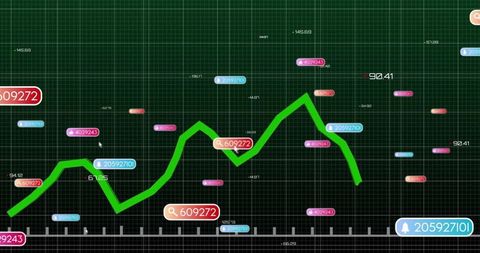
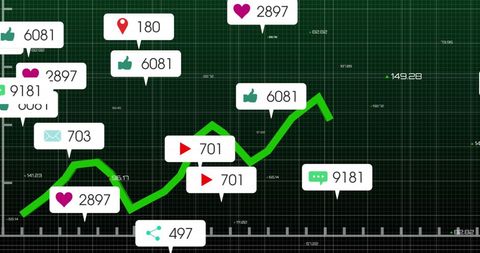
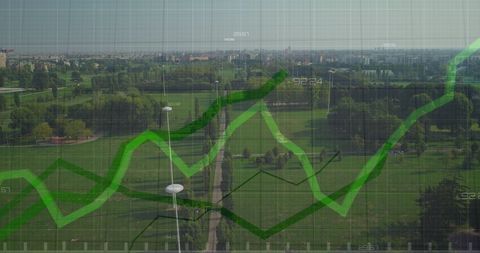
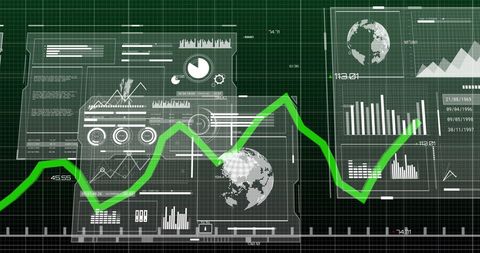
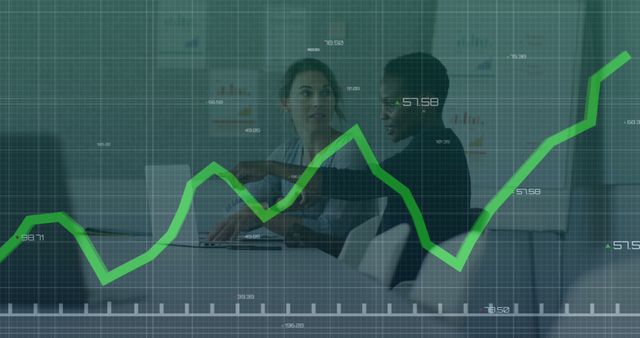
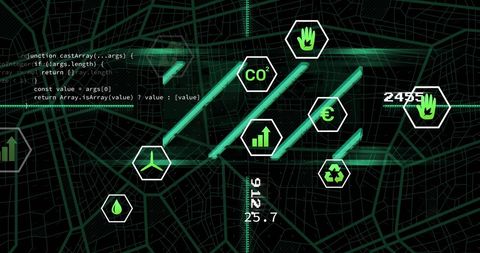
Trend line fluctuating on digital dashboard with hexagonal icons representing economic and ecological themes. Ideal for presentations on data analysis, sustainable business strategies, or showcasing futuristic technology. Visualizes complex data in user-friendly way, highlighting significance of eco consciousness in modern financial decision making.

Powered by Shutterstock logo - Get 15% off with code: PIKWIZARD15
Displaying green line graph zigzagging in trading interface with binary digits and numeric labels. Finance, data visualization, technology, analytics, digital, futuristic, business - Powered by Shutterstock - Get 15% off with code: PIKWIZARD15Displaying chart on grid showing bars and colored lines, percentage labels, candlesticks, red arrow. Data visualization, finance, analytics, technical, digital, modern, dashboard - Powered by Shutterstock - Get 15% off with code: PIKWIZARD15Displaying bar chart on financial dashboard screen, with overlaid line graphs and percentage labels. Finance, analytics, data visualization, dashboard, investment, market trends, business intelligence - Powered by Shutterstock - Get 15% off with code: PIKWIZARD15Showing chart floating over wind turbines in interface, with bar charts and candlesticks. Data visualization, renewable energy, technology, analytics, innovation, sustainability, digital interface - Powered by Shutterstock - Get 15% off with code: PIKWIZARD15Showing green trend line over white grid on screen, with numeric labels, ticks, red downward arrow. Analytics, finance, bar chart, bar graph, data visualization, dashboard, infographic - Powered by Shutterstock - Get 15% off with code: PIKWIZARD15

Credit Photo

If you would like to credit the Photo, here are some ways you can do so

Free (free of charge)

Free for personal and commercial use.

Author: Awesome Content

Similar Free Stock Images

Rising Green Line on Financial Digital Display
Premium
Displaying finance interface showing tickers with percentages and green line graphs in trading room. Technology, data visualization, financial analysis, digital dashboard, corporate, modern,
Financial Data Skewing Over Chemical Structure Background
Graph Overlay on Business Meeting, Data Analysis Concept
Abstract Financial Graphs Displaying Market Trends
Financial Data Graph Over Urban Cityscape
Premium
Displaying bars and green line plotting values on grid dashboard interface, arrow, numeric labels. Analytics, data, visualization, dashboard, growth, innovation, finance
Data Analysis with Green Graph and Virus Cells Background
Financial Statistics Superimposed on 3D Model
Eco Data Visualization with Environmental Icons and Graphs
Financial Data Visualization with Green Graph Line on Blue Background
Premium
Displaying green blue red trend lines on dark grid trading screen, showing +11.73% +6.31%. Financial analysis, data visualization, stock market, technical chart, digital dashboard, investment,
Abstract Graph with Social Media Notification Icons and Data Points
Rising Data Graph with Changing Numbers on Blue Grid
Financial Data Processing with Futuristic Interface and World Map
Green Financial Graph Overlaying Urban Cityscape
Premium
Monitoring adult male in sports shirt studying finance dashboards in control hub, floating charts. Futuristic, data visualization, analytics, technology, innovation, interface, productivity
Dynamic Red Line Graph on Digital Data Grid Background
Digital Stock Market Graph with Abstract Coding Background
Green Financial Data Chart with Technological Overlay
Digital Data Processing Analysis Over Computer Servers
Premium
Displaying trading dashboard on screen at desk, with candlestick bars, trend line, HUD timestamps. Finance, data visualization, dashboard, analytics, technology, investment, screen
Abstract Scientific Data Visualization with Molecule Structures and Light Trails
Abstract Data Visualization with Graphs over Digital Grid Background
Rising Green Financial Chart on Viral Pandemic Background
Digital Interface Abstract with Green Data Line and Scanning Scopes
Premium
Showing green orange red data lines fluctuating on interface, with numeric labels white axis ticks. Futuristic, analytical, vibrant, technology, dashboard, data visualization, digital interface
Businesswoman with Suitcase Walking Viewed Through Financial Analytics
Green Energy Graph with Analytics Icons and Data on Dashboard
Green Line Graph on Digital Grid Displaying Market Trends
Innovative Technology Dashboard Displaying Analytics and Trends
Dynamic Graphs Depicting Financial Trends on Purple Grid Background
Dynamic Financial Data Chart with Green Line Graph
Premium
Central candlestick bars and green trend line moving on trading screen, with ticker symbol overlays. Financial analysis, market data, digital interface, data visualization, economic trends,
Diverse Businesswomen Analyzing Financial Growth with Digital Graph Overlay
Digital Data Infographic Detail with Data Points and Graphs
Dynamic Digital Interface with Green Technology Icons
Ecology Interface with Icons and Data Elements
Premium
Displaying data visualization on screen, with green bars, red-and-green line and grid overlay. Futuristic, abstract, technology, analytics, digital, innovation, dashboard
Graph Icons Hologram with Social Media Notifications
Digital Lock with Real-Time Data Display
Financial Market Chart on Digital Screen Showing Growing Trends
Financial Analytics Chart in Digital Interface Design
Premium
Showing globe on right of screen with candlestick bars, red trend line, code overlays, copy space. Financial analytics, data visualization, market trends, digital dashboard, technology, financial
Rising Chart Line Over Digital Grid Representing Financial Growth
Global Data Transformation and Connectivity Icons on World Map
Global Data Processing Medical Interface Digital Display
Green Bar and Line Graph on Dark Interface
Premium
Displaying green hexagon icons and charts on virtual dashboard, with CO₂ and economic arrow. Technology, data visualization, analytics, sustainability, finance, innovation, digital interface
Data Center with Rising Trends on Digital Graph
Digital Financial Data and Graph Display with Codes
Green Bar Graph and Rising Line Graph Depicting Data Analysis
Dynamic Financial Graph with Bar Chart on Digital Grid
Premium
Showing dashboard above woman wearing blazer checking tablet at office with charts, copy space. Analytics, data visualization, fintech, technology, investment, professional, innovation
Global Financial Data and Social Media Escalation Chart
Rising Trend Line in Digital Graph with Network Connections for Data Analysis
Green Line Chart on Digital Grid with Financial Data Points
3D Green Bars and Line Graph on Dark Grid Background for Data Visualization
Premium
Displaying 3D bar chart rising on wireframe grid in virtual dashboard, with green red data columns. Financial, analytics, futuristic, data visualization, digital, technology, business
Soccer Competition with Digital Analytics Overlay Merging Sports and Data
Dynamic Financial Chart with Currency Symbols and Digital Network
Couple Wading in Water With Green Financial Chart Overlay
Digital Interface Concept with Data Processing on Servers
Futuristic Financial Graphs with Dynamic Green Line
Rising Green Market Graph Overlay in Dimly Lit Cityscape
Premium
Displaying line chart fluctuating on market terminal, with green bars, percentages and grid overlay. Analytics, data visualization, finance, technology, digital interface, investment, performance
Cryptocurrency Growth Chart Over Digital World Map
Digital Network Connections and Data Processing Collage
Financial Data Visualized over Urban Cityscape
Dynamic Graph Analysis over Covid-19 Virus Cells
Premium
Displaying translucent green 3D bars on dark grid chart, showing bright polyline and grass texture. Data, visualization, analytics, columns, overlay, trend, agriculture
Data Processing Overlay on Circuit Board Background
Visualizing Trends in Financial Data with Code and Graphs
Digital Interface Displaying Statistical Data Trends
Digital Data Visualization with Global Analytics Interface
Premium
Displaying green line chart trending upward on financial dashboard with numeric and code overlays. Technology, analytics, data, visualization, digital, finance, innovation
Futuristic 3D Graph Illustration with Data Overlay
Holographic Financial Graphs and Data Representation
Dynamic Financial Graph with Growth Patterns on Digital Screen
Digital Financial Data and Network Connections Visual
Premium
Showing green line chart fluctuating on dashboard, with map pins, thumbs-up, heart and mail icons. Data visualization, financial analysis, performance metrics, digital interface, data-driven,
Rising Data Graph Over Digital Servers in Futuristic Environment
Colorful Financial Graphs on Digital Grid Background
Dynamic Financial Data Graph Visualization on Black Background
Digital Decline Graphic with QR Code Elements and Red Line
Premium
Displaying blue world map on dashboard interface, with neon trend lines and hexagon overlays. Digital, technology, futuristic, data, visualization, innovation, analytics
Dynamic Green Financial Graph with Business Icons
Futuristic Data Visualization with Global Analytics Interface
Fluctuating Financial Data with Graph Overlay
Digital Green Line on Grid with Financial Data and Graphic Spiral Overlay
Premium
Displaying blueprint grid over laptop silhouette, showing green line chart with axis scale markings. Financial analytics, data visualization, technology, digital industry, corporate, professional
Digital Sustainability Data Visualization with Futuristic Icons
Interactive dashboard callout displaying 95 messages over 3D green bar chart and polyline
Futuristic DNA Strand Visualization with Digital Data Interface
Analyzing Network Connections Over Financial Data
Rising Data and Statistics on Global Map in Green Interface Design
Colorful Digital Financial Analytics Interface for Data Visualization
Premium
Green 3D globe floating on trading dashboard with trend lines, candlestick bars and numeric data. Technology, finance, data visualization, digital, analytics, innovation, corporate
Financial Data Growth Over Urban Cityscape with Graph Overlay
Financial Market Growth Over City Skyline
Green Bar Graph with Fluctuating Line Chart Depicting Financial Analysis
Global Eco-Friendly Concepts with Data Overlay
Premium
Displaying bright green line graph with numeric labels on blueprint grid overlaying book silhouette. Analytics, data, visualization, technology, finance, dashboard, innovation
Green Line Chart with Financial Data on Dark Background
Social Media Notifications and Growth Chart Dynamics
Dynamic Financial Growth Graph on Blue Grid Background
Innovation in Green Technology Amidst Urban Expansion
Premium
Dark blue grid filling screen when green bars rising while candlestick line animating marking peaks. Analytics, finance, data visualization, dashboard, digital interface, stock market, performance
Financial Data Graph with Rising Green Line and Analytics Dashboard
Dynamic Global Data Insights with Trend Lines
Dynamic Financial Statistics with Cityscape Overlay
Green Graph Showing Forex Trends on Transparent Cyber Interface
Premium
Woman using stylus above glowing green market chart, illustrating stock trading, investment analysis, and financial growth with mobile technology and real-time data visualization.
Digital Interface with Overlapping Code and Graph
Futuristic Data Interface with Abstract Green Graphics
Green Line Graph Overlaid on Empty Office with Data Overlay
Dynamic Financial Market Graph with Data Points
Premium
Displaying energy dashboard on black interface, with green bars, candlestick line and energy icons. Analytics, infographics, futuristic, technology, sustainability, finance, data visualization
Green Analytics Line Graph on Dark Grid Background
Futuristic Zigzag Line Graph with Digital Data Labels
Digital Stock Market Data Visualization with Binary Interface
Futuristic Energy Metrics with Neon Icons on Digital Dashboard
Premium
Displaying green line graph varying over pale grid overlay on blurred gray surface, numeric labels. Technology, analytics, data visualization, dashboard, business intelligence, digital interface,
Global financial dashboard showing green 3D bar chart and neon line graph over Earth