- Home >
- Stock Photos >
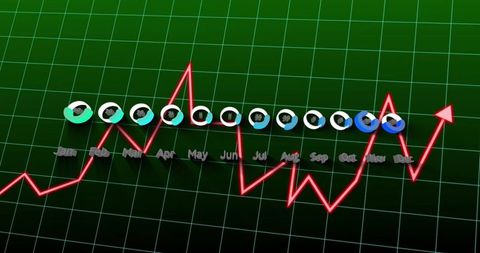
- Data Visualization Dashboard with Interactive Metric Icons
Data Visualization Dashboard with Interactive Metric Icons Image

Innovative turquoise circle bar chart displayed on analytics dashboard grid, highlighting real-time social interaction metrics such as likes and comments. Suitable for illustrating data-driven business reporting or digital media monitoring. Ideal for presentations, articles, or educational materials on effective data visualization.

downloads
Tags:
More
Credit Photo
If you would like to credit the Photo, here are some ways you can do so
Text Link
photo Link
<span class="text-link">
<span>
<a target="_blank" href=https://pikwizard.com/photo/data-visualization-dashboard-with-interactive-metric-icons/cb2ad1f1137dfd402ec1f3244240c8d0/>PikWizard</a>
</span>
</span>
<span class="image-link">
<span
style="margin: 0 0 20px 0; display: inline-block; vertical-align: middle; width: 100%;"
>
<a
target="_blank"
href="https://pikwizard.com/photo/data-visualization-dashboard-with-interactive-metric-icons/cb2ad1f1137dfd402ec1f3244240c8d0/"
style="text-decoration: none; font-size: 10px; margin: 0;"
>
<img src="https://pikwizard.com/pw/medium/cb2ad1f1137dfd402ec1f3244240c8d0.jpg" style="margin: 0; width: 100%;" alt="" />
<p style="font-size: 12px; margin: 0;">PikWizard</p>
</a>
</span>
</span>
Free (free of charge)
Free for personal and commercial use.
Author: People Creations