- Home >
- Stock Photos >
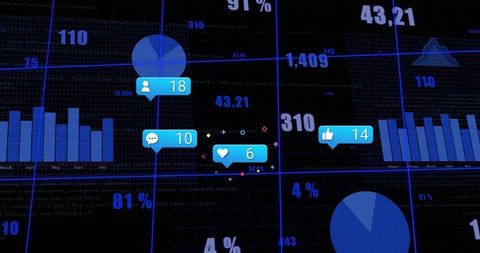
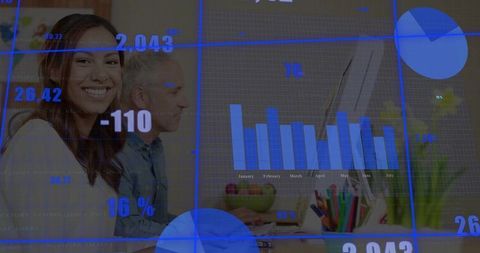
- Data Visualization Digital Interface with Bar Chart Analytics
Data Visualization Digital Interface with Bar Chart Analytics Image

Ideal for presentations or articles focused on financial analysis, business intelligence, or digital media. Represents technological advancements in data transparency and operational decision-making with emphasis on analytics metrics.

downloads
Tags:
More
Credit Photo
If you would like to credit the Photo, here are some ways you can do so
Text Link
photo Link
<span class="text-link">
<span>
<a target="_blank" href=https://pikwizard.com/photo/data-visualization-digital-interface-with-bar-chart-analytics/46481a4973b3c7d1d8616bc84d610eb8/>PikWizard</a>
</span>
</span>
<span class="image-link">
<span
style="margin: 0 0 20px 0; display: inline-block; vertical-align: middle; width: 100%;"
>
<a
target="_blank"
href="https://pikwizard.com/photo/data-visualization-digital-interface-with-bar-chart-analytics/46481a4973b3c7d1d8616bc84d610eb8/"
style="text-decoration: none; font-size: 10px; margin: 0;"
>
<img src="https://pikwizard.com/pw/medium/46481a4973b3c7d1d8616bc84d610eb8.jpg" style="margin: 0; width: 100%;" alt="" />
<p style="font-size: 12px; margin: 0;">PikWizard</p>
</a>
</span>
</span>
Free (free of charge)
Free for personal and commercial use.
Author: Authentic Images