
- Home >
- Stock Photos >
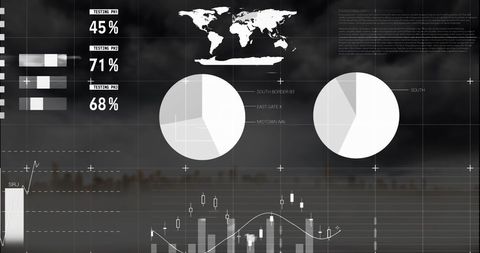
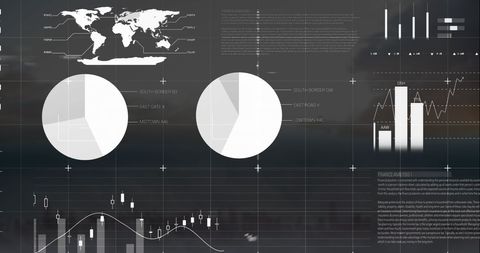
- Data Visualization Display over Modern City
Data Visualization Display over Modern City Image

This visual blends a digital infographic interface with a fog-laden cityscape under a cloudy sky, merging abstract analytical data visuals with urban elements. The integration of pie and bar charts showcases growth and global report insights, making it ideal for illustrating topics related to business intelligence, digital marketing strategies, finance, or urban growth. Useful for digital presentations or as a header image for investment and research publications.
Powered by 


downloads
Tags:
More
Credit Photo
If you would like to credit the Photo, here are some ways you can do so
Text Link
photo Link
<span class="text-link">
<span>
<a target="_blank" href=https://pikwizard.com/photo/data-visualization-display-over-modern-city/e52c33d58b61588ea4914364a2f781f1/>PikWizard</a>
</span>
</span>
<span class="image-link">
<span
style="margin: 0 0 20px 0; display: inline-block; vertical-align: middle; width: 100%;"
>
<a
target="_blank"
href="https://pikwizard.com/photo/data-visualization-display-over-modern-city/e52c33d58b61588ea4914364a2f781f1/"
style="text-decoration: none; font-size: 10px; margin: 0;"
>
<img src="https://pikwizard.com/pw/medium/e52c33d58b61588ea4914364a2f781f1.jpg" style="margin: 0; width: 100%;" alt="" />
<p style="font-size: 12px; margin: 0;">PikWizard</p>
</a>
</span>
</span>
Free (free of charge)
Free for personal and commercial use.
Author: Awesome Content
Similar Free Stock Images

Premium


Premium


Premium


Premium

Premium


Premium


Premium


Premium

Premium

Premium


Premium

Premium


Premium

Premium


Premium


Premium

Premium


Premium


Premium


Premium


Premium


Premium


Premium


Premium

Premium


Explore More Free Stock Images