- Home >
- Stock Photos >
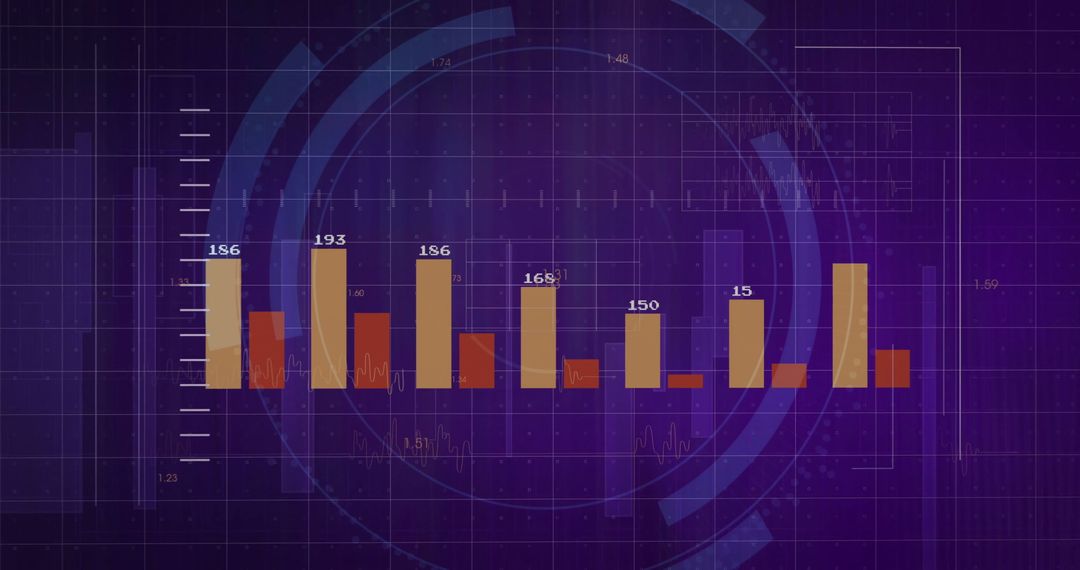
- Data Visualization Illustrating Market Trends with Graphs and Charts
Data Visualization Illustrating Market Trends with Graphs and Charts Image

This depicts bar graphs and line charts displaying fluctuating data. Useful for presentations in finance and analytics sectors, conveying economic trends, illustrating reports on market behavior, and enhancing visual storytelling in business analytics.
Powered by 


0
downloads
downloads
Tags:
More
Credit Photo
If you would like to credit the Photo, here are some ways you can do so
Text Link
photo Link
<span class="text-link">
<span>
<a target="_blank" href=https://pikwizard.com/photo/data-visualization-illustrating-market-trends-with-graphs-and-charts/043245133973c7f0fbd8025c2db409fa/>PikWizard</a>
</span>
</span>
<span class="image-link">
<span
style="margin: 0 0 20px 0; display: inline-block; vertical-align: middle; width: 100%;"
>
<a
target="_blank"
href="https://pikwizard.com/photo/data-visualization-illustrating-market-trends-with-graphs-and-charts/043245133973c7f0fbd8025c2db409fa/"
style="text-decoration: none; font-size: 10px; margin: 0;"
>
<img src="https://pikwizard.com/pw/medium/043245133973c7f0fbd8025c2db409fa.jpg" style="margin: 0; width: 100%;" alt="" />
<p style="font-size: 12px; margin: 0;">PikWizard</p>
</a>
</span>
</span>
Free (free of charge)
Free for personal and commercial use.
Author: People Creations
Similar Free Stock Images

Premium


Premium


Premium


Premium


Premium


Premium


Premium


Premium


Premium


Premium


Premium


Premium


Premium


Premium


Premium


Premium


Premium


Premium


Premium


Premium


Premium


Premium


Premium


Premium