
- Home >
- Stock Photos >
- Data Visualization in Energy Analytics Dashboard Overlay
Data Visualization in Energy Analytics Dashboard Overlay Image
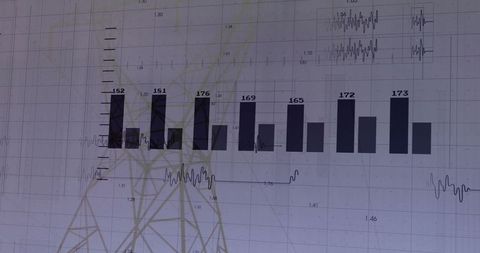
Diagram represents analytics in the technology and power industry, enhancing digital data presentations. Ideal for use in tech and energy sector reports or presentations to illustrate trends and statistical insights.
Powered by 


downloads
Tags:
More
Credit Photo
If you would like to credit the Photo, here are some ways you can do so
Text Link
photo Link
<span class="text-link">
<span>
<a target="_blank" href=https://pikwizard.com/photo/data-visualization-in-energy-analytics-dashboard-overlay/83af2807f7dc70c528a150324fe60514/>PikWizard</a>
</span>
</span>
<span class="image-link">
<span
style="margin: 0 0 20px 0; display: inline-block; vertical-align: middle; width: 100%;"
>
<a
target="_blank"
href="https://pikwizard.com/photo/data-visualization-in-energy-analytics-dashboard-overlay/83af2807f7dc70c528a150324fe60514/"
style="text-decoration: none; font-size: 10px; margin: 0;"
>
<img src="https://pikwizard.com/pw/medium/83af2807f7dc70c528a150324fe60514.jpg" style="margin: 0; width: 100%;" alt="" />
<p style="font-size: 12px; margin: 0;">PikWizard</p>
</a>
</span>
</span>
Free (free of charge)
Free for personal and commercial use.
Author: Awesome Content