- Home >
- Stock Photos >
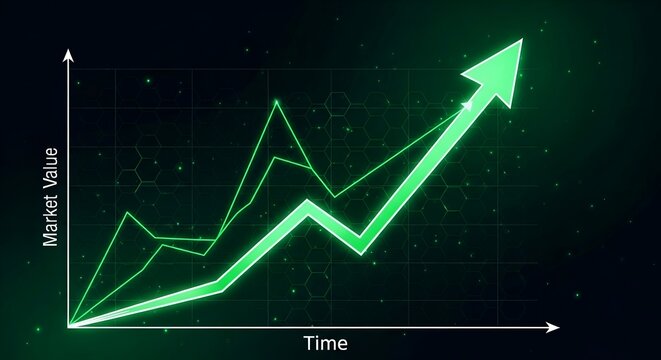
- Data Visualization in Finance: Growing Stock Market Trends
Data Visualization in Finance: Growing Stock Market Trends Image

This image illustrates financial data visualization with a green line graph overlaid on textual and statistical elements, highlighting growing trends in the stock market. Ideal for use in financial reports, economic studies, and educational materials focused on data analytics and investment strategies.
Powered by 


2
downloads
downloads
Tags:
More
Credit Photo
If you would like to credit the Photo, here are some ways you can do so
Text Link
photo Link
<span class="text-link">
<span>
<a target="_blank" href=https://pikwizard.com/photo/data-visualization-in-finance-growing-stock-market-trends/ff63bbe88eedde1a1d8bf5e14b223f33/>PikWizard</a>
</span>
</span>
<span class="image-link">
<span
style="margin: 0 0 20px 0; display: inline-block; vertical-align: middle; width: 100%;"
>
<a
target="_blank"
href="https://pikwizard.com/photo/data-visualization-in-finance-growing-stock-market-trends/ff63bbe88eedde1a1d8bf5e14b223f33/"
style="text-decoration: none; font-size: 10px; margin: 0;"
>
<img src="https://pikwizard.com/pw/medium/ff63bbe88eedde1a1d8bf5e14b223f33.jpg" style="margin: 0; width: 100%;" alt="" />
<p style="font-size: 12px; margin: 0;">PikWizard</p>
</a>
</span>
</span>
Free (free of charge)
Free for personal and commercial use.
Author: Authentic Images
Similar Free Stock Images

Premium


Premium


Premium


Premium


Premium


Premium


Premium


Premium


Premium


Premium


Premium


Premium


Premium


Premium


Premium


Premium


Premium


Premium


Premium


Premium


Premium


Premium


Premium


Premium


Premium