
- Home >
- Stock Photos >
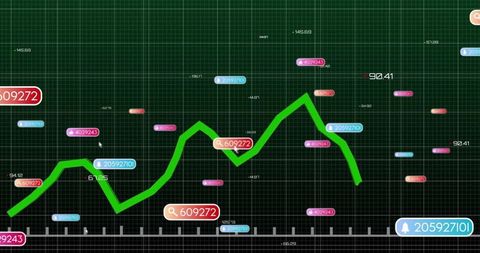
- Data Visualization Interface with Analytics and Trend Line on Digital Grid
Data Visualization Interface with Analytics and Trend Line on Digital Grid Image

Image showcases a graphical representation of data, featuring a red trend line over a digital blue grid. The design includes notification and chat icons, with various numeric data points. Ideal for illustrating financial or social media trends, diverse statistical analyses, or data-driven projects demanding visual interfaces. Suitable for technology enterprises, educational displays on data interpretation, or presentations about interface design.
Powered by 


downloads
Tags:
More
Credit Photo
If you would like to credit the Photo, here are some ways you can do so
Text Link
photo Link
<span class="text-link">
<span>
<a target="_blank" href=https://pikwizard.com/photo/data-visualization-interface-with-analytics-and-trend-line-on-digital-grid/291970649d83d7c4c1755cb03549ba48/>PikWizard</a>
</span>
</span>
<span class="image-link">
<span
style="margin: 0 0 20px 0; display: inline-block; vertical-align: middle; width: 100%;"
>
<a
target="_blank"
href="https://pikwizard.com/photo/data-visualization-interface-with-analytics-and-trend-line-on-digital-grid/291970649d83d7c4c1755cb03549ba48/"
style="text-decoration: none; font-size: 10px; margin: 0;"
>
<img src="https://pikwizard.com/pw/medium/291970649d83d7c4c1755cb03549ba48.jpg" style="margin: 0; width: 100%;" alt="" />
<p style="font-size: 12px; margin: 0;">PikWizard</p>
</a>
</span>
</span>
Free (free of charge)
Free for personal and commercial use.
Author: Awesome Content
Similar Free Stock Images

Premium


Premium


Premium


Premium


Premium


Premium

Premium

Premium


Premium


Premium


Premium


Premium


Premium


Premium


Premium


Premium

Premium


Premium


Premium


Premium

Premium

Premium


Premium


Premium


Premium


Explore More Free Stock Images