1. Home > 
  2. Stock Photos > 
  3. Data Visualization Metrics Display with Charts and Graphs

Data Visualization Metrics Display with Charts and Graphs Image

Data Visualization Metrics Display with Charts and Graphs

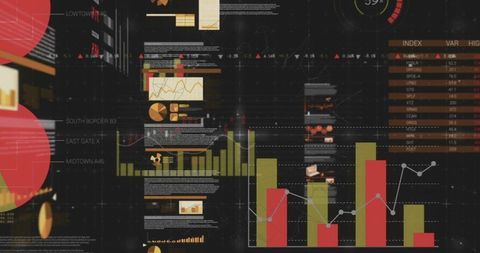
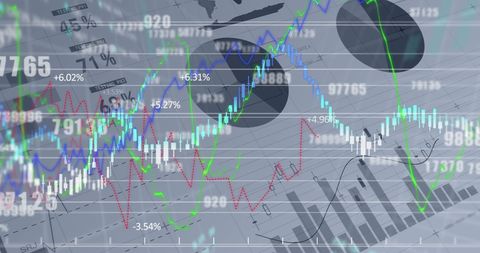
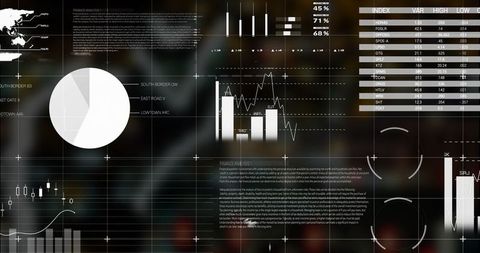
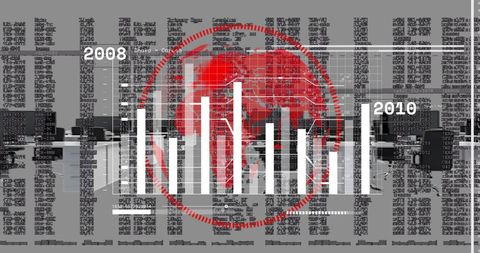
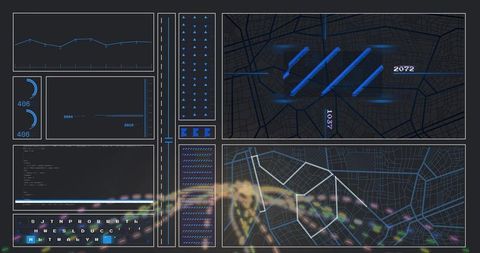
This abstract illustration depicts a complex data visualization dashboard. Featuring circular gauges, a central pie chart, and an underlying histogram, it conveys high-tech and analytical concepts. Use for illustrating articles on data science, business intelligence, or informational technology interfaces in presentations, blogs, and reports highlighting the importance of data analytics in corporate or technological settings.

Powered by Shutterstock logo - Get 15% off with code: PIKWIZARD15
Analyst working with Business, Concept digital transformation technology strategy, Analytics and Data Management System on computer, make a report with KPI and metrics connected to database. - Powered by Shutterstock - Get 15% off with code: PIKWIZARD15Businessman using laptop computer analyzing sales data and financial growth graph chart report. Business planning, strategy and development. Financial accounting. market research, data analysis - Powered by Shutterstock - Get 15% off with code: PIKWIZARD15Dashboard finance management on laptop computer analyzing sales data and growth graph chart report. Business planning, strategy and development. Financial accounting. market research, data analysis - Powered by Shutterstock - Get 15% off with code: PIKWIZARD15KPI data analytics concept, Key performance indicator analysis system. Information technology digital software management. Visualization tech solution. Business artificial intelligence. AI dashboard. - Powered by Shutterstock - Get 15% off with code: PIKWIZARD15Man look at the dashboard with graphs and charts. Concept of data management system, business intelligence, data statistics, marketing analysis, key performance indicators (KPI) and analytics. - Powered by Shutterstock - Get 15% off with code: PIKWIZARD15

Credit Photo

If you would like to credit the Photo, here are some ways you can do so

Free (free of charge)

Free for personal and commercial use.

Author: Awesome Content

Similar Free Stock Images

Digital Financial Data Dashboard with Bar and Line Graphs
Premium
Digital approval and task management with futuristic interface. Businessman using stylus on tablet to complete checklist, analyze data on smart dashboard. Concept of workflow automation, e-signature.
Analyzing Global Finance with Graphical Data
Digital Interface Displaying Live Data and Networking Concepts
Financial Data Analysis with Graphs and Charts on Abstract Grid
Global Data Processing with AI Concept in a Digitally Swapped Reality
Premium
Data analytics and insights powered by big data and AI technologies. Data scientist analysing complex information with artificial intelligence for business analytics dashboard with charts and metrics.
Digital Circuitry Hacked Signal Data Breach Conceptual
Global Financial Data Processing Illustrating Business Connections
Global Data Analytics and Network Visualization on Digital Grid
Futuristic Data Interface with Digital Graphs
Premium
Professional data analyst using data visualizations dashboard on computer monitor for data business analysis and Data Management System
Futuristic Interface on Digital Circuit Board Background
Digitally Generated Global Financial Data Visuals
Cybersecurity Shield Protects Digital Data With Technology Background
Digital Phishing Alert over Data Background
Premium
Professional data analyst using data visualizations dashboard on computer monitor for data business analysis and Data Management System
Futuristic Interface with World Map and Data Analytics
Digital Cyber Security System Breach with Glitch Effect
Data Analysis Illustration in Server Room with Graph Interfaces
Complex Digital Dashboard Interface Displaying Financial Data and Growth Analytics
Premium
Man viewing website traffic analytics data on tablet computer
Futuristic Digital Finance Dashboard with Charts and Tickers
Futuristic Dashboard Interface with Red Circular Overlay and World Map
Futuristic Digital Dashboard Interface with Analytics Graphics
Futuristic Data Interface with Numbers and Analytics
Premium
Leaning woman in white blouse, man reviewing laptop charts at home study with papers and mug. Collaboration, teamwork, analytics, dashboard, data, visualization, graphs
Futuristic Digital Interface Highlighting Growth Hacking Concepts
Global Data Visualization with Digital Interface and Speech Bubbles
Futuristic Data Visualization in Cyberspace with Analytics Panels
Abstract C++ Programming Code with Futuristic Interface Elements
Futuristic Digital Interface with Graphs and Data
Digital Data Processing Interface Over City Map
Premium
Data analytics and insights powered by big data and artificial intelligence technologies. Data scientist working with complex information analysed by AI for business analytics dashboard with charts.
Global Digital Interface Visualizing Data Processing
Futuristic Financial Data Interface over Digital Grid
Data Processing with Cryptocurrency Analytics and Statistics Concept
Stagflation Concept with Data and Graph Visualization
Premium
Businessman pointing chart financial goals and economic business planning global.
Stock Market Analysis Digital Screen with Graphs and Trends
Dynamic Financial Data Analysis on Blue Digital Interface
Digital Virus Warning with Holographic Interface Design
Abstract Digital Interface with Rotating Geometric Shapes
Premium
Man look at the dashboard with graphs and charts. Concept of data management system, business intelligence, data statistics, marketing analysis, key performance indicators (KPI) and analytics.
Digital Fintech Visualization with Graphs and Data Icons
Abstract Digital Data Screens with Statistical Graphics
Financial Data Processing with Charts and Graphics on Digital Blue Background
Digital Data Processing with Text Overlay on Grid Background
Premium
A hand interacts with glowing holographic data graphs and charts, showcasing futuristic digital visualization on a dark background. Concept of innovation
Dynamic Data Visualization with Charts and Analytics Dashboards
Advanced Data Visualization Interface Black Background
Digital Interface Displaying Data Processing Analytics on Black Background
Digital Interface with Globe and Data Overlays on Black Background
Premium
Analysts use computers to analyze statistical data to improve targeted digital online marketing strategies for a business advantage. Data Science Software Developer.
Futuristic Analytics and Cybersecurity Dashboard Interface
Global Financial Dashboard with Red Downward Trend Line Graph
Futuristic Digital Dashboard in Virtual Command Center
Colorful Line Graph on Digital Analytics Interface
Premium
A businessman uses a laptop to access an AI-powered business analytics dashboard, showcasing charts, metrics, and KPIs. He analyzes performance data to generate. Data analysis concept.
Dynamic Financial Trading Dashboard with Neon Lines and Candlestick Charts
Futuristic Wireframe Car Over Data Grid and World Map Visualization
Digital Dashboard Displaying Analytics and Financial Indicators
Digital Globe Overlay with Financial Data Streams
Global Finance Graphs and Data Technology Landscape
Digital Interface with Stock Market Graphs and Statistics
Premium
A high-tech environment featuring a hand interacting with a futuristic transparent touchscreen display, showcasing data analytics and digital visuals for business insights.
Futuristic Digital Data Processing with Graphs and Interfaces
Futuristic Data Processing with Digital Displays
Cybersecurity Breach Concept with Hacked Data and Digital Circuits
Digital Finance Analytics in Modern Business Environment
Premium
Business data visualization dashboard analytic on laptop screen business data scientist with ai analysis and bar, donut, pie chart data summarise management digital market statistic summary analytics
Complex Financial Data Visualization with Graphs and Charts
Dynamic Data Analytics Interface Showing Statistical Trends
Digital Financial Data and Analytics Over Office Desk
Digital Financial Dashboard with Analytics and Data Visualization
Premium
Panorama shot analyst team utilizing BI Fintech to analyze financial report with laptop. Businesspeople analyzing BI power dashboard displayed on laptop screen for business insight. Scrutinize
Data Connections and Network Interface with Circular Scanner
Digital Data Interfaces on Black Background for Global Computing
Abstract Digital Interface and Data Visualization on Cityscape
Global Financial Data Processing with Graphs and Charts on Dark Background
Premium
Analyst team utilizing BI Fintech to analyze financial report with tablet over paper on table and analyzing BI power dashboard display on tablet screen for business insight. Panorama shot. Scrutinize
Digital Interface Displaying Data Processing and Statistics
Futuristic Data Analysis Concepts with Neon Graphs
Dynamic Digital Charts and Financial Data Visualization
Futuristic Growth Hacking Dashboard Visualization with Data Panels
Premium
Businessman analyze and visualize complex information on a virtual screen using AI to process data. Big data technology and data science.Data flow.Digital neural network.artificial intelligence
Digital Data Dashboard with Interactive Charts
Cybersecurity Digital Map with Code and Data Lines
Futuristic Cyber Dashboard with Binary Streams and Global Maps
Futuristic Data Visualization with Graph and 3D Elements
Premium
Business development and technology Data analyst. business analytics dashboard Business Intelligence (BI) data visualization, metrics and KPI key performance indicators and reports management.
Futuristic Analytics Dashboard Interface with Data Visualization
Red Skull Silhouette Dominating Cyber HUD Telemetry Overlay with Futuristic Data Panels
Futuristic Financial Data and Digital Cityscape Visualization
Dynamic Financial Charts and Data for Market Analysis
Abstract Chart and Graphs Illustrating Digital Data Analysis
Futuristic Financial Data Visualization
Premium
Analyst working with Business Analytics and Data Management System on computer to make report with KPI and metrics connected to database. Corporate strategy for finance, operations, sales, marketing
Futuristic Data Visualization with Interactive Charts and Numbers
Digital Crypto Firewall Technology
Futuristic Digital Data Visualizations and Statistics Interface
Futuristic Digital Interface with Complex Data Visualization Elements
Premium
businessman working with business Analytics and Data Management System on computer, online document management and metrics connected to database. Corporate strategy for finance, operations, sales.
Digital Data Visualization with Global Networking Elements
Digital Virus and Data Processing Interface
Digital Finance Data Visualization on Black Background
Digital Interface with Graphs and Data Overlaid on Building
Premium
Data analysis, business intelligence, market research concept. Businessman using digital tablet with financial report, big data technology, analytics dashboard, finance and data science
Futuristic Data Visualization with Global Network Connections
Technological Data Processing Interface with Global Maps
Dynamic Digital Interface Displaying Financial Data Analysis
Digital Financial Data Interface on Dark Background
Premium
BI data dashboard from Fintech on laptop screen displays comprehensive business analysis in empty office. Technology empowering business financial data visualization and growth strategy. Prodigy
Digital Data Processing and Analytics in Modern Business Innovation
Data Processing Visualization in Futuristic Digital Interface
Futuristic Data Terminal Interface with Digital Overlays
Futuristic Cyberpunk Interface with Data Visualization Dashboard
Premium
Futuristic Digital Growth Chart – 3D Bar Graph with Glowing Blue Data Visualization
Futuristic Bitcoin Symbol with Financial Data and Digital Circuit
Digital Data Flow Interface with Orange Icons and Numerical Labels
Futuristic Digital Dashboard with Candlestick Graphs and Data Panels
Global Data Network Visualization with Timeline
Premium
Advanced Digital Traffic Analysis, Business Professional Utilizing Cutting-Edge Technology and AI to Enhance Website Performance and User Engagement Through Detailed Data Insights, Strategic Planning
Futuristic red globe HUD displaying cyber dashboard overlays and analytics data