- Home >
- Stock Photos >
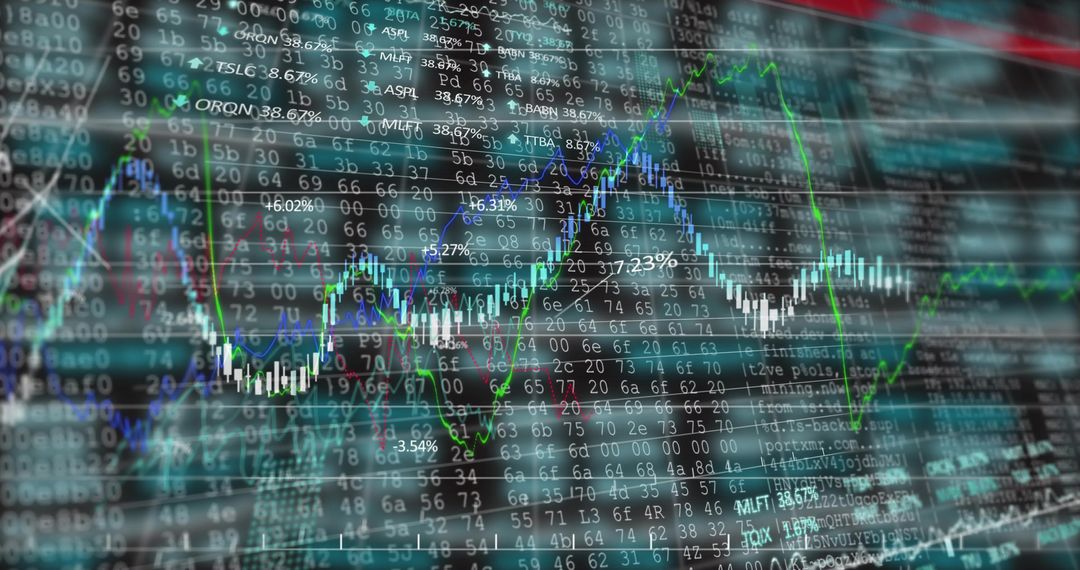
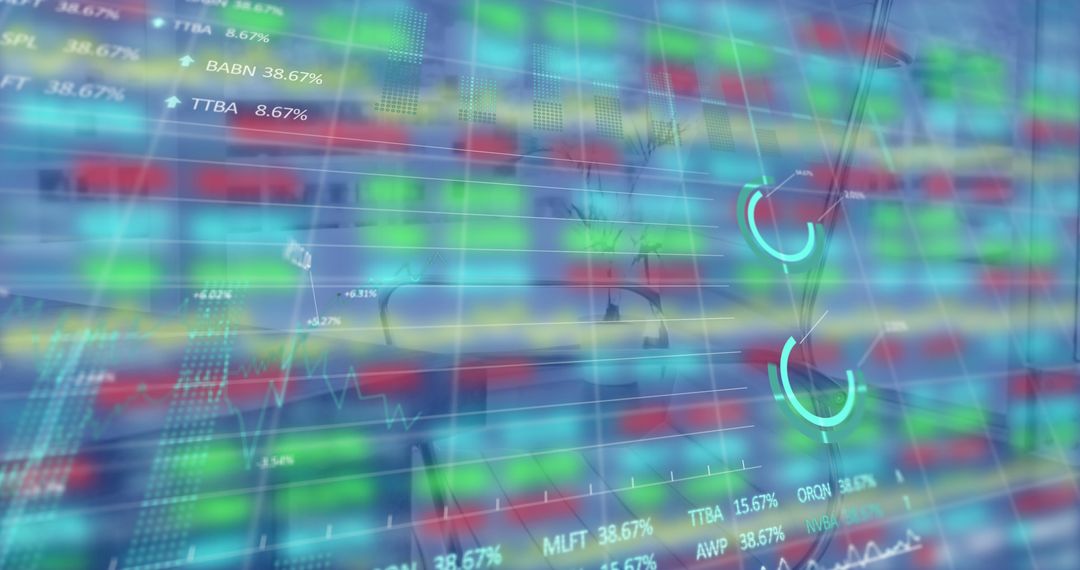
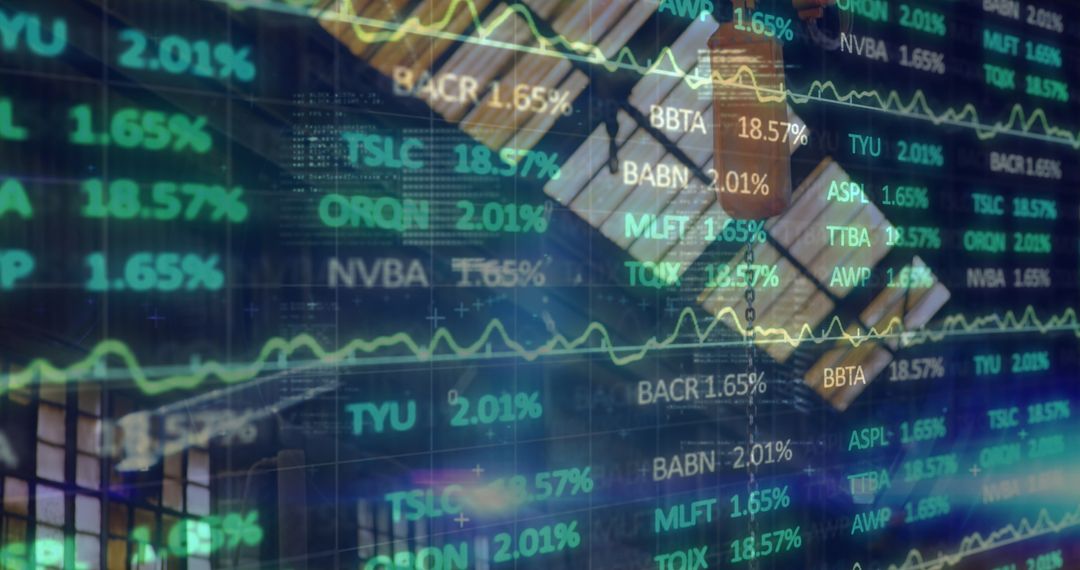
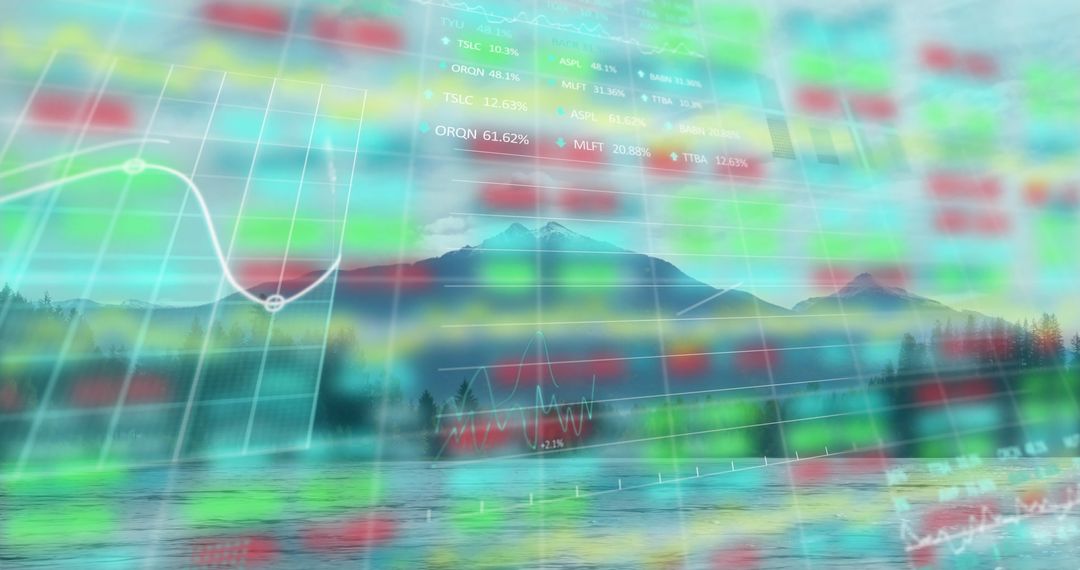
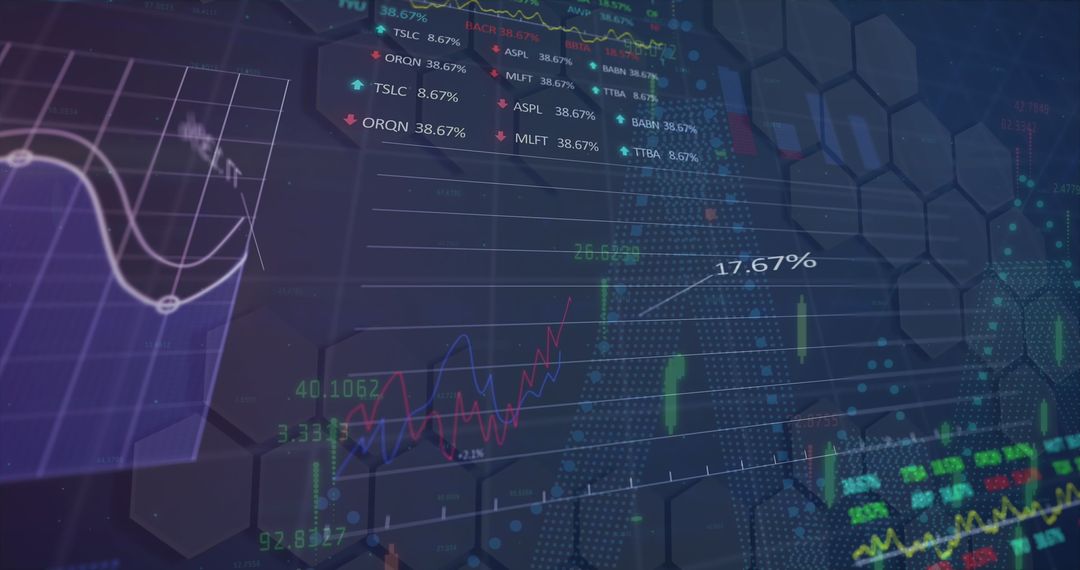
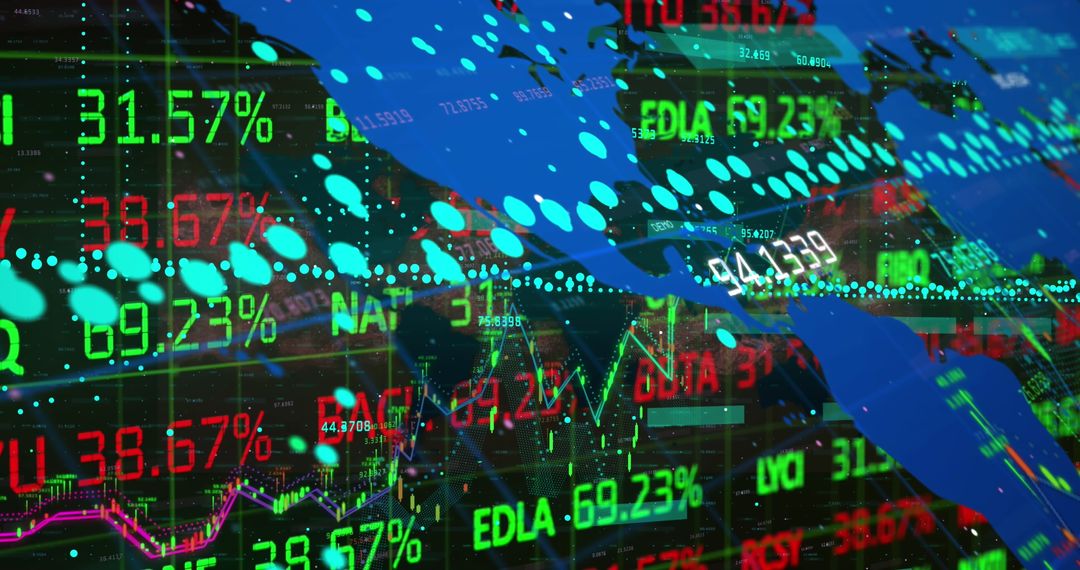
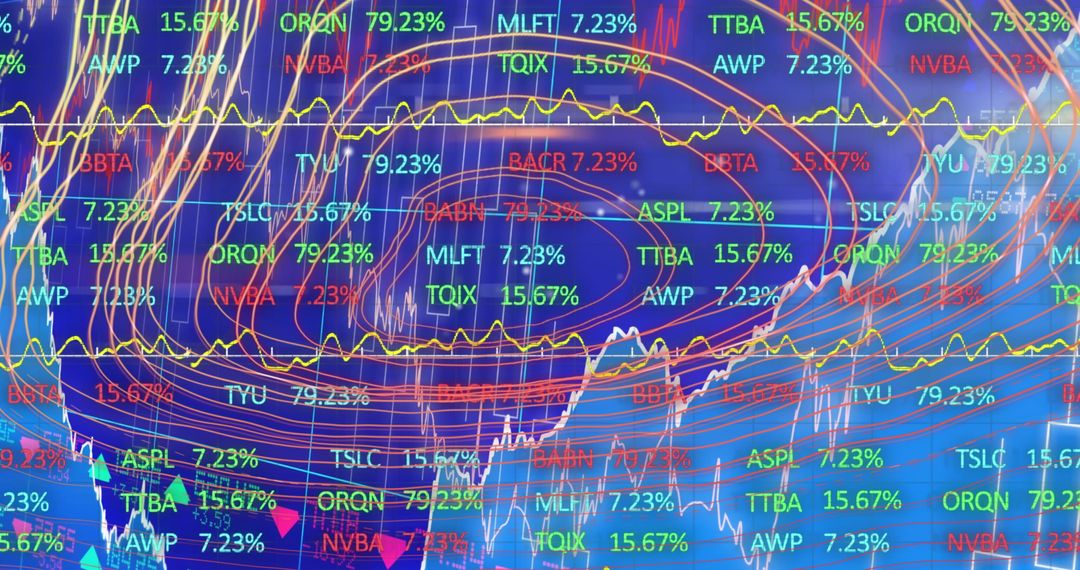
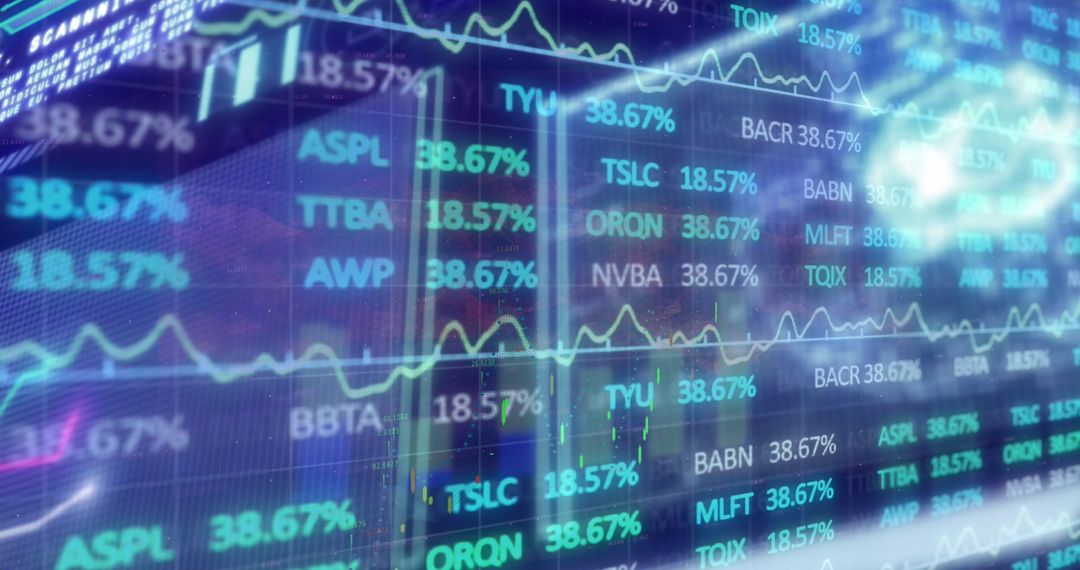
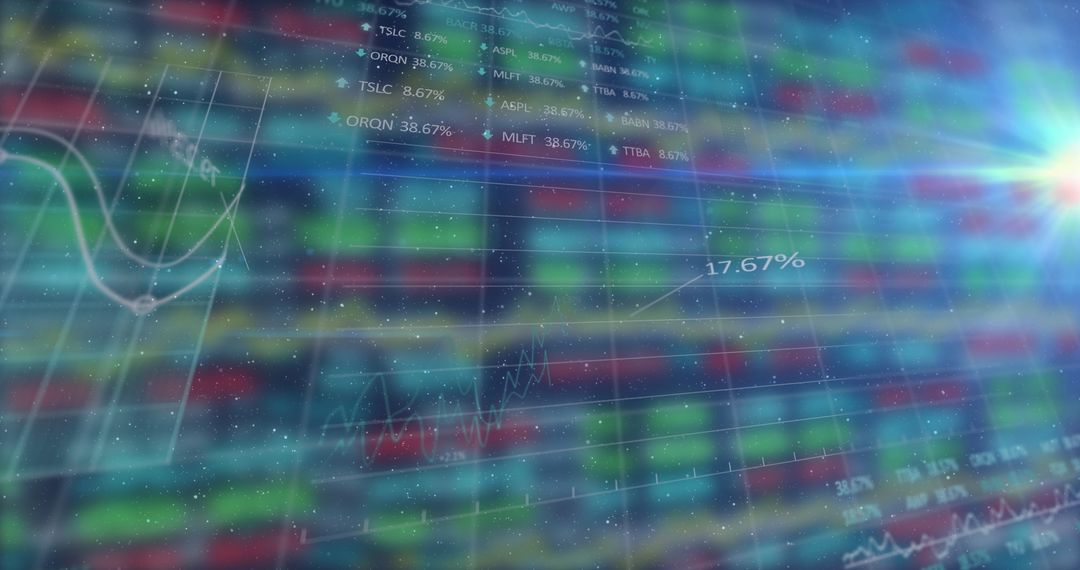
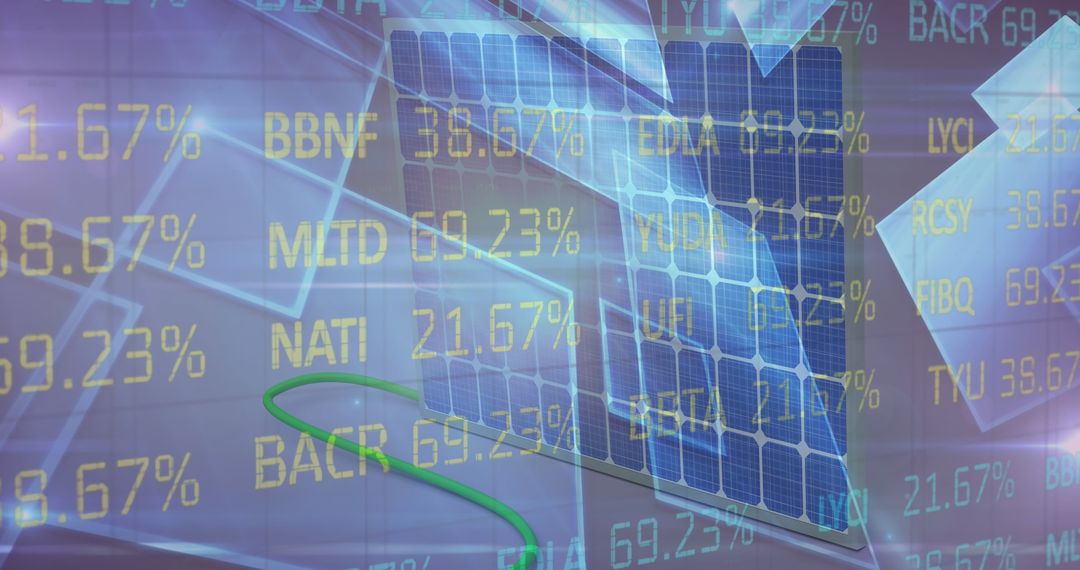
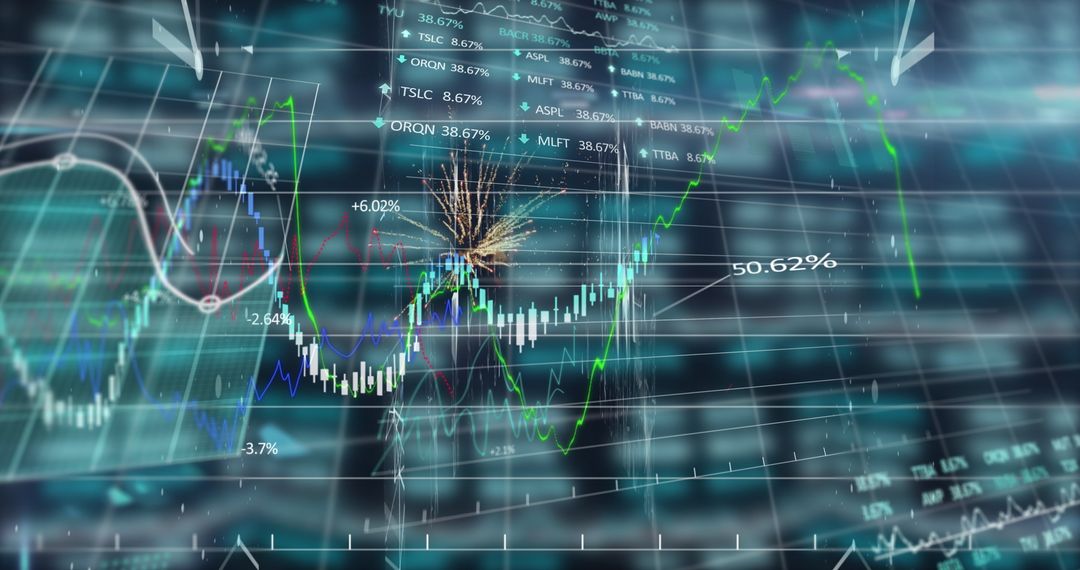
- Data Visualization of Financial Dashboard Heatmap with Tickers
Data Visualization of Financial Dashboard Heatmap with Tickers Image
Complex financial dashboard displays in-depth stock market analytics with a vividly colored heatmap, showing tickers and percentage changes essential for investment analysis. Ideal for use in presentations on financial analysis, investment strategies, or technology trend reports highlighting corporate finance and analytics development.
Powered by 


2
downloads
downloads
Tags:
More
Credit Photo
If you would like to credit the Photo, here are some ways you can do so
Text Link
photo Link
<span class="text-link">
<span>
<a target="_blank" href=https://pikwizard.com/photo/data-visualization-of-financial-dashboard-heatmap-with-tickers/fc7ce65a1c7cd9d1263aa804c6b0d88f/>PikWizard</a>
</span>
</span>
<span class="image-link">
<span
style="margin: 0 0 20px 0; display: inline-block; vertical-align: middle; width: 100%;"
>
<a
target="_blank"
href="https://pikwizard.com/photo/data-visualization-of-financial-dashboard-heatmap-with-tickers/fc7ce65a1c7cd9d1263aa804c6b0d88f/"
style="text-decoration: none; font-size: 10px; margin: 0;"
>
<img src="https://pikwizard.com/pw/medium/fc7ce65a1c7cd9d1263aa804c6b0d88f.jpg" style="margin: 0; width: 100%;" alt="" />
<p style="font-size: 12px; margin: 0;">PikWizard</p>
</a>
</span>
</span>
Free (free of charge)
Free for personal and commercial use.
Author: Authentic Images
Similar Free Stock Images

Premium

Premium


Premium


Premium


Premium


Premium


Premium


Premium


Premium


Premium


Premium


Premium


Premium


Premium


Premium


Premium


Premium


Premium


Premium


Premium


Premium

Premium


Premium


Premium