
- Home >
- Stock Photos >
- Data Visualization on Digital Dashboard with Fluctuating Graphs
Data Visualization on Digital Dashboard with Fluctuating Graphs Image
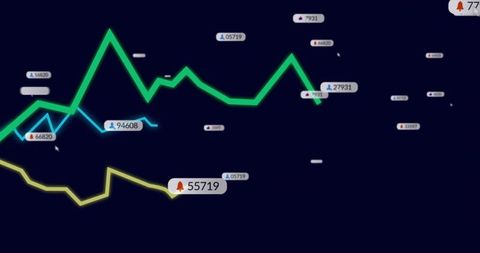
Vivid representation of data trends using fluctuating green and yellow curves on a digital dashboard. Ideal for illustrating concepts like financial analytics, data patterns, and technological interfaces in presentations or online articles related to business analytics and data interpretation.
Powered by  - Get 15% off with code: PIKWIZARD15


downloads
Tags:
More
Credit Photo
If you would like to credit the Photo, here are some ways you can do so
Text Link
photo Link
<span class="text-link">
<span>
<a target="_blank" href=https://pikwizard.com/photo/data-visualization-on-digital-dashboard-with-fluctuating-graphs/80cfd01eb23d7e6ff651f968bd5d9dee/>PikWizard</a>
</span>
</span>
<span class="image-link">
<span
style="margin: 0 0 20px 0; display: inline-block; vertical-align: middle; width: 100%;"
>
<a
target="_blank"
href="https://pikwizard.com/photo/data-visualization-on-digital-dashboard-with-fluctuating-graphs/80cfd01eb23d7e6ff651f968bd5d9dee/"
style="text-decoration: none; font-size: 10px; margin: 0;"
>
<img src="https://pikwizard.com/pw/medium/80cfd01eb23d7e6ff651f968bd5d9dee.jpg" style="margin: 0; width: 100%;" alt="" />
<p style="font-size: 12px; margin: 0;">PikWizard</p>
</a>
</span>
</span>
Free (free of charge)
Free for personal and commercial use.
Author: Awesome Content