- Home >
- Stock Photos >
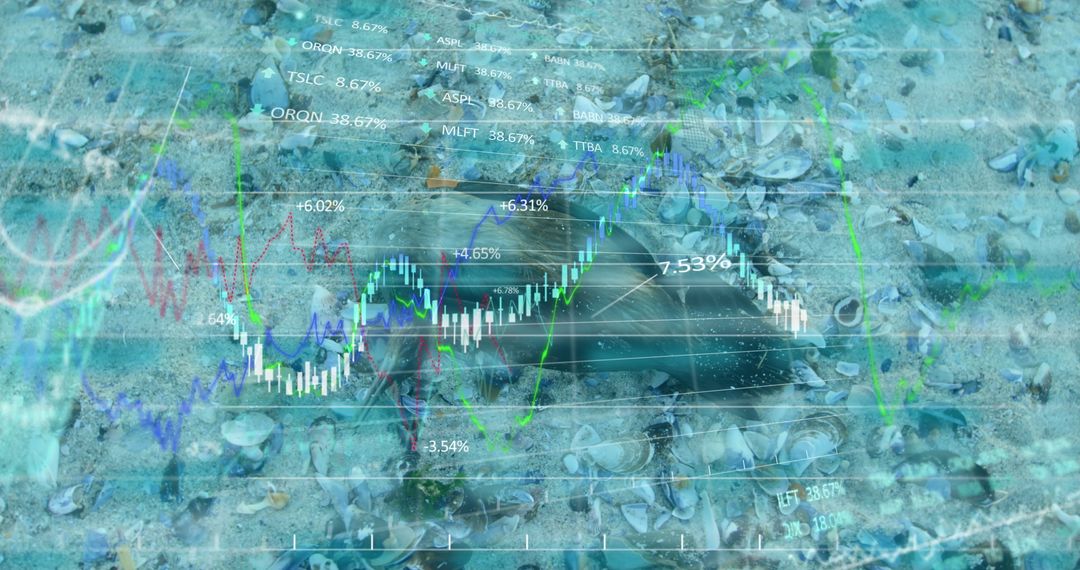
- Data Visualization on Sandy Beach with Colorful Graphs and Footprints
Data Visualization on Sandy Beach with Colorful Graphs and Footprints Image
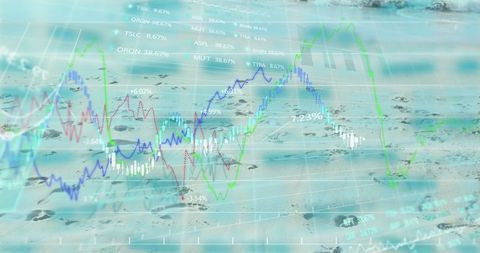
Visually captivating stock photo combines financial data appearance with beach setting, overlaying colorful line charts, grids, and percentage indicators. Sandy background with footprints adds artistic twist to digital analytics. Ideal for financial blogs exploring markets during holiday or discussing market fluctuation, broth promotional material merging finance with nature, creative data-driven campaigns, stock market trends presentations or beachside economic summits with visual flourishes driving creative conversations.
Powered by  - Get 15% off with code: PIKWIZARD15


2
downloads
downloads
Tags:
More
Credit Photo
If you would like to credit the Photo, here are some ways you can do so
Text Link
photo Link
<span class="text-link">
<span>
<a target="_blank" href=https://pikwizard.com/photo/data-visualization-on-sandy-beach-with-colorful-graphs-and-footprints/452f186d5709a4493348385ad8869136/>PikWizard</a>
</span>
</span>
<span class="image-link">
<span
style="margin: 0 0 20px 0; display: inline-block; vertical-align: middle; width: 100%;"
>
<a
target="_blank"
href="https://pikwizard.com/photo/data-visualization-on-sandy-beach-with-colorful-graphs-and-footprints/452f186d5709a4493348385ad8869136/"
style="text-decoration: none; font-size: 10px; margin: 0;"
>
<img src="https://pikwizard.com/pw/medium/452f186d5709a4493348385ad8869136.jpg" style="margin: 0; width: 100%;" alt="" />
<p style="font-size: 12px; margin: 0;">PikWizard</p>
</a>
</span>
</span>
Free (free of charge)
Free for personal and commercial use.
Author: Awesome Content
Similar Free Stock Images

Premium


Premium


Premium


Premium


Premium


Premium


Premium


Premium


Premium


Premium


Premium


Premium


Premium


Premium


Premium


Premium


Premium


Premium


Premium


Premium


Premium


Premium


Premium


Premium