
- Home >
- Stock Photos >
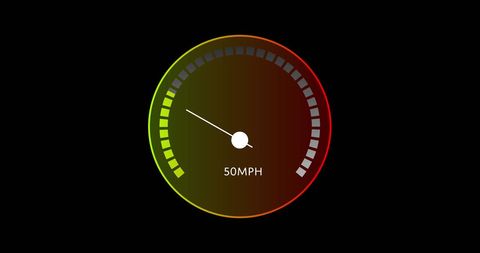
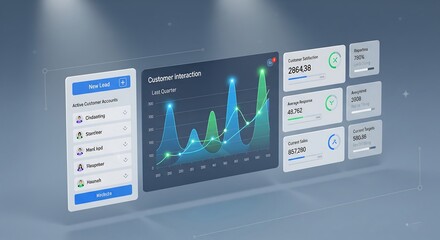
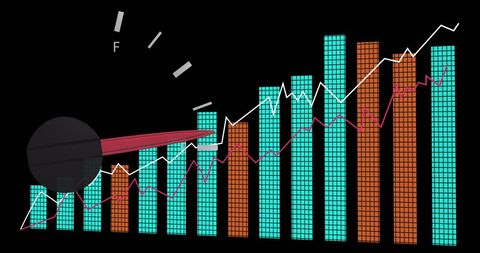
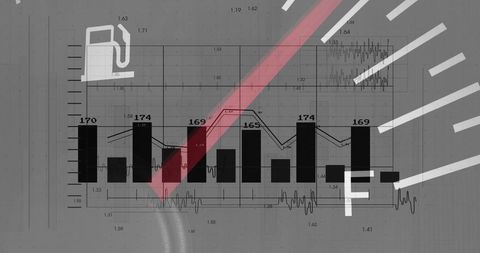
- Data Visualization Over Audi Dashboard Concept
Data Visualization Over Audi Dashboard Concept Image

Illustration features digital interface with financial charts overlaid on a car dashboard, signifying the fusion of technology with automotive analytics. Ideal for use in materials related to digital innovations in the automotive industry, tech-driven financial analysis, or global business concepts.
Powered by 


downloads
Tags:
More
Credit Photo
If you would like to credit the Photo, here are some ways you can do so
Text Link
photo Link
<span class="text-link">
<span>
<a target="_blank" href=https://pikwizard.com/photo/data-visualization-over-audi-dashboard-concept/dc3b4f1b277ab7b5cf9e1a5ff5a4ce70/>PikWizard</a>
</span>
</span>
<span class="image-link">
<span
style="margin: 0 0 20px 0; display: inline-block; vertical-align: middle; width: 100%;"
>
<a
target="_blank"
href="https://pikwizard.com/photo/data-visualization-over-audi-dashboard-concept/dc3b4f1b277ab7b5cf9e1a5ff5a4ce70/"
style="text-decoration: none; font-size: 10px; margin: 0;"
>
<img src="https://pikwizard.com/pw/medium/dc3b4f1b277ab7b5cf9e1a5ff5a4ce70.jpg" style="margin: 0; width: 100%;" alt="" />
<p style="font-size: 12px; margin: 0;">PikWizard</p>
</a>
</span>
</span>
Free (free of charge)
Free for personal and commercial use.
Author: Creative Art
Similar Free Stock Images

Premium


Premium


Premium


Premium


Premium


Premium


Premium


Premium


Premium


Premium


Premium

Premium


Premium

Premium

Premium


Premium


Premium


Premium


Premium


Premium


Premium


Premium

Premium


Premium


Premium

Explore More Free Stock Images