
- Home >
- Stock Photos >
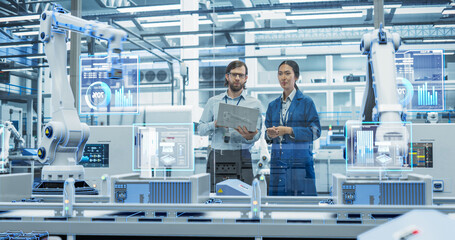
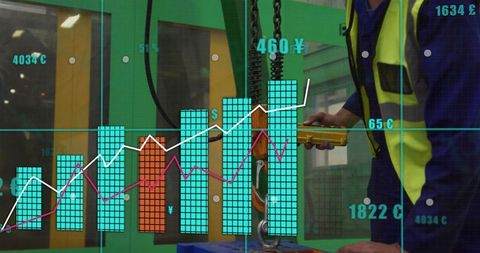
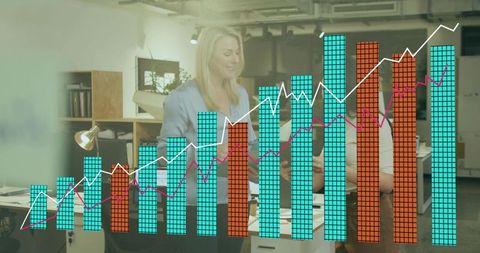
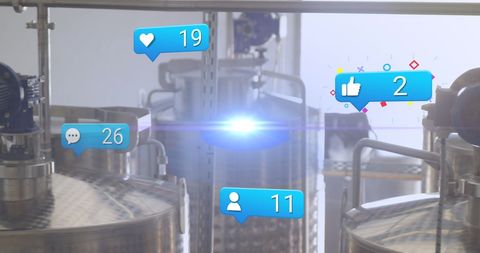
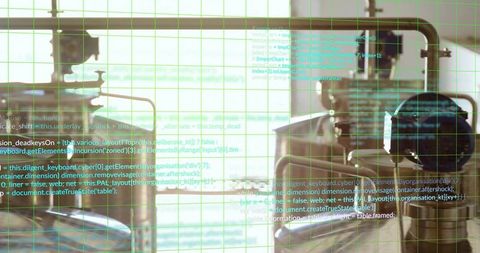
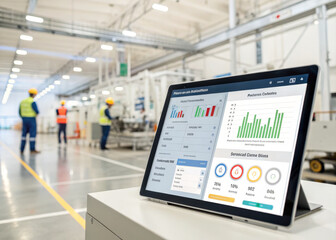
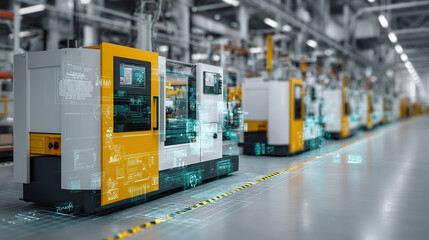
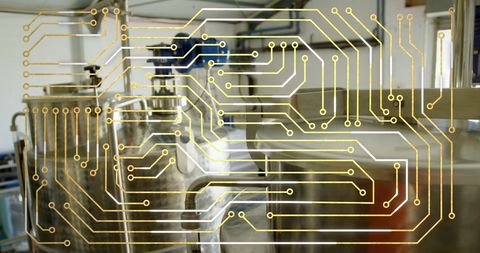
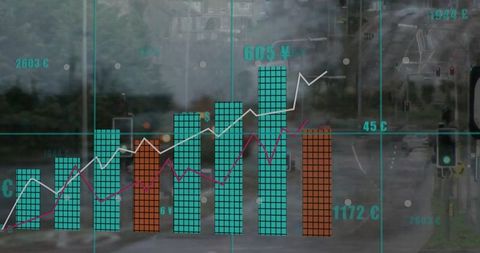
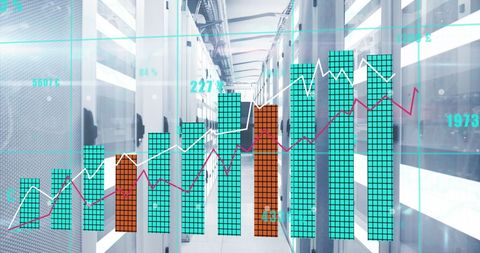
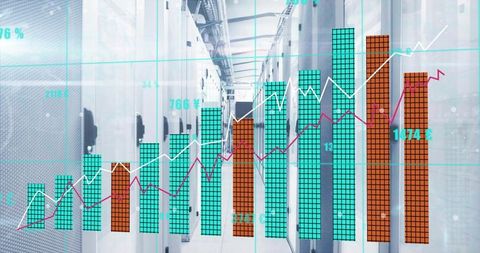
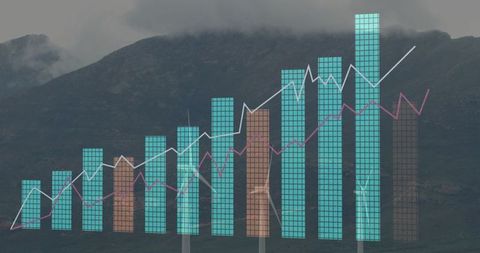
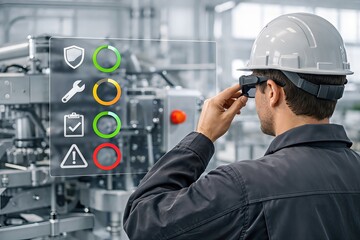
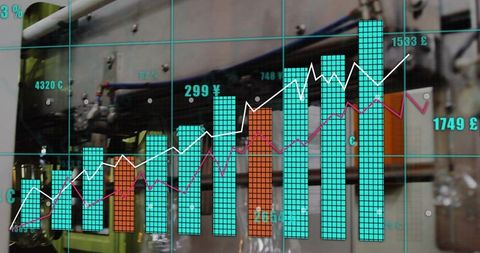
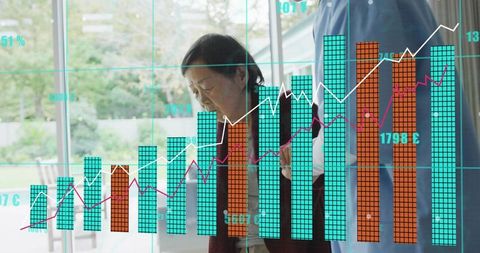
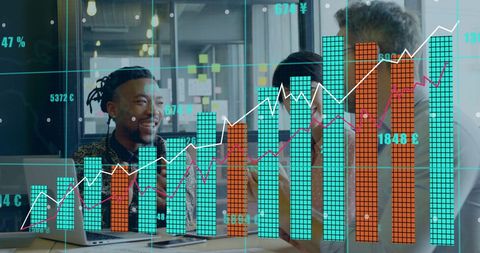
- Data Visualization Over Industrial Machinery Indicating Technological Integration
Data Visualization Over Industrial Machinery Indicating Technological Integration Image
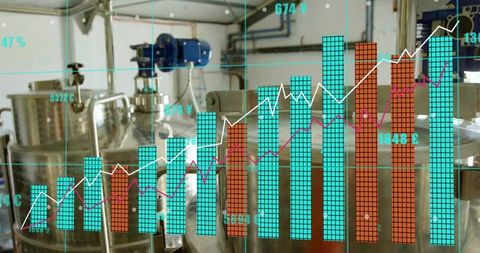
This visual merges intricate industrial machinery vibes with digital analytics, showcasing how modern technology transforms traditional industries. Useful for illustrating advancements in automation, data integration, and process control within the |manufacturing sector. Perfect for articles and presentations on industry 4.0 and digital technologies in factories.
Powered by 


downloads
Tags:
More
Credit Photo
If you would like to credit the Photo, here are some ways you can do so
Text Link
photo Link
<span class="text-link">
<span>
<a target="_blank" href=https://pikwizard.com/photo/data-visualization-over-industrial-machinery-indicating-technological-integration/0ff148b37f665effb6df0e37bb284300/>PikWizard</a>
</span>
</span>
<span class="image-link">
<span
style="margin: 0 0 20px 0; display: inline-block; vertical-align: middle; width: 100%;"
>
<a
target="_blank"
href="https://pikwizard.com/photo/data-visualization-over-industrial-machinery-indicating-technological-integration/0ff148b37f665effb6df0e37bb284300/"
style="text-decoration: none; font-size: 10px; margin: 0;"
>
<img src="https://pikwizard.com/pw/medium/0ff148b37f665effb6df0e37bb284300.jpg" style="margin: 0; width: 100%;" alt="" />
<p style="font-size: 12px; margin: 0;">PikWizard</p>
</a>
</span>
</span>
Free (free of charge)
Free for personal and commercial use.
Author: Authentic Images
Similar Free Stock Images
Premium
Premium

Premium


Premium


Premium


Premium


Premium


Premium


Premium


Premium

Premium

Premium


Premium
Premium


Premium


Premium
Premium

Premium


Premium


Premium


Premium


Premium


Premium


Premium


Premium

Explore More Free Stock Images