
- Home >
- Stock Photos >
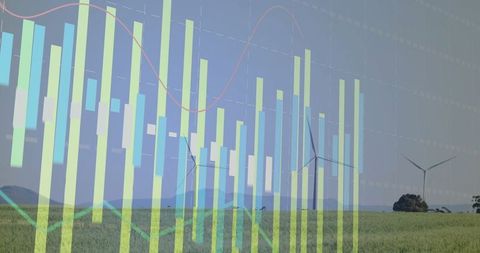
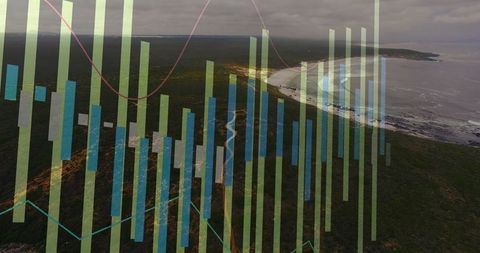
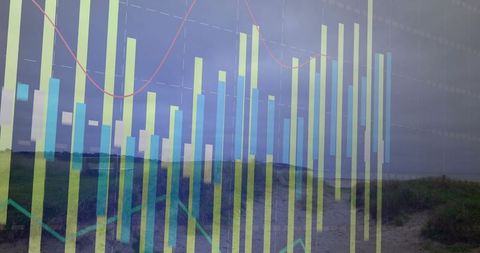
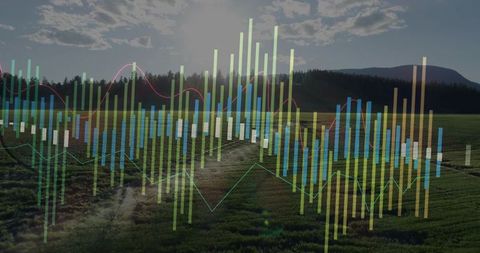
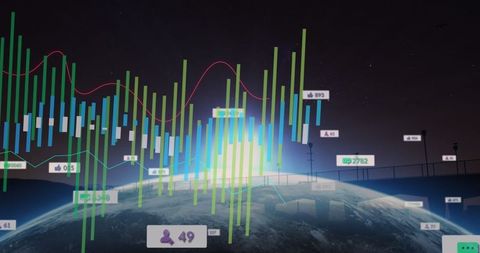
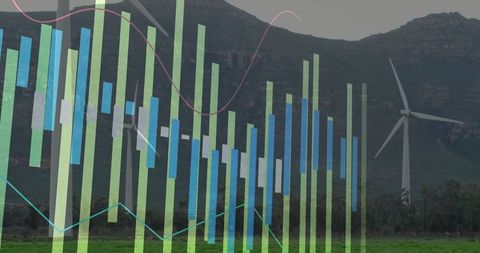
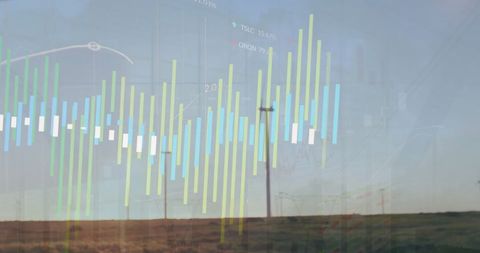
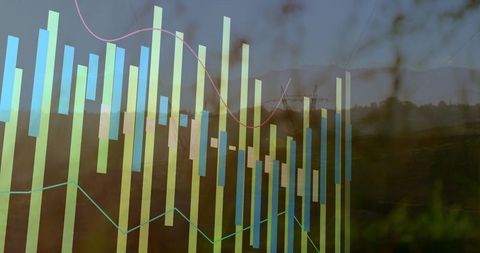
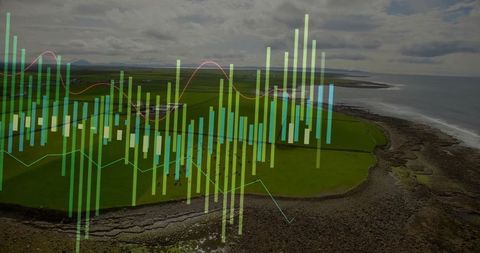
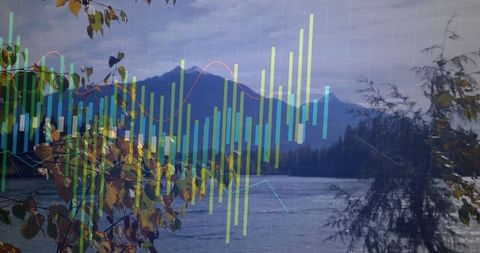
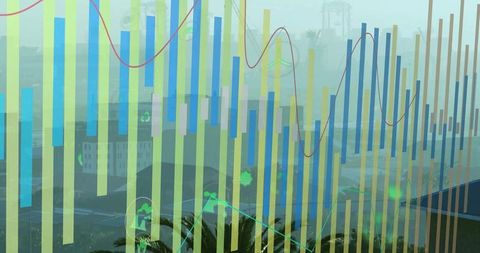
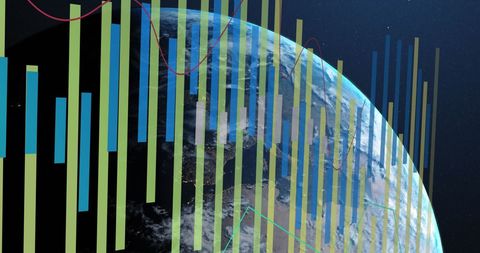
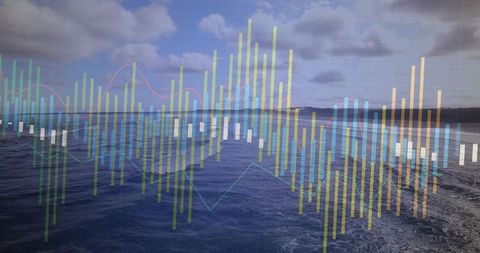
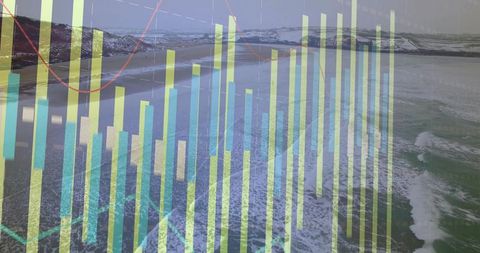
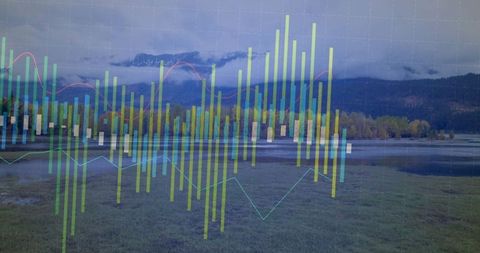
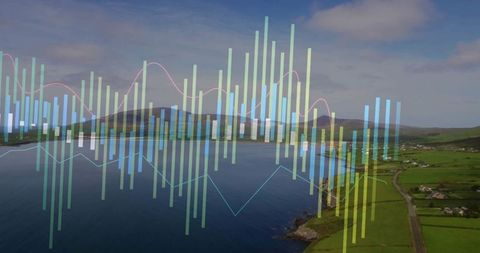
- Data Visualization Over Serene Lakeside at Dawn
Data Visualization Over Serene Lakeside at Dawn Image
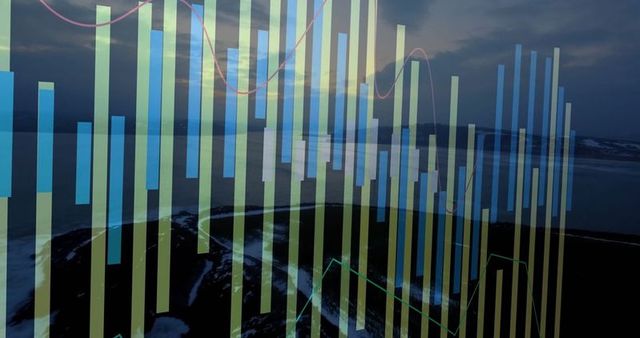
Visuals show transparent data charts blending with tranquil lakeside at dawn, illustrating integration of analytics and serene nature. Useful for tech industry and financial services illustrating harmony between data insights and natural beauty.
Powered by 


downloads
Tags:
More
Credit Photo
If you would like to credit the Photo, here are some ways you can do so
Text Link
photo Link
<span class="text-link">
<span>
<a target="_blank" href=https://pikwizard.com/photo/data-visualization-over-serene-lakeside-at-dawn/f84cb8fc35b88ea1d379c8ccb9b89c35/>PikWizard</a>
</span>
</span>
<span class="image-link">
<span
style="margin: 0 0 20px 0; display: inline-block; vertical-align: middle; width: 100%;"
>
<a
target="_blank"
href="https://pikwizard.com/photo/data-visualization-over-serene-lakeside-at-dawn/f84cb8fc35b88ea1d379c8ccb9b89c35/"
style="text-decoration: none; font-size: 10px; margin: 0;"
>
<img src="https://pikwizard.com/pw/medium/f84cb8fc35b88ea1d379c8ccb9b89c35.jpg" style="margin: 0; width: 100%;" alt="" />
<p style="font-size: 12px; margin: 0;">PikWizard</p>
</a>
</span>
</span>
Free (free of charge)
Free for personal and commercial use.
Author: Authentic Images
Similar Free Stock Images
Premium


Premium


Premium


Premium
Premium


Premium


Premium


Premium


Premium


Premium


Premium

Premium


Premium
Premium

Premium


Premium

Premium


Premium


Premium


Premium


Premium


Premium


Premium


Premium


Premium


Explore More Free Stock Images