
- Home >
- Stock Photos >
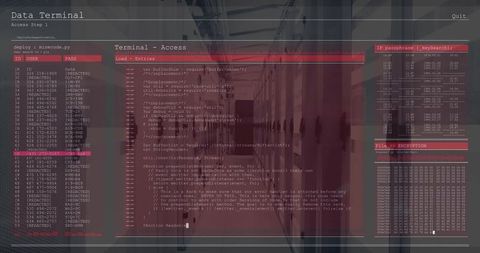
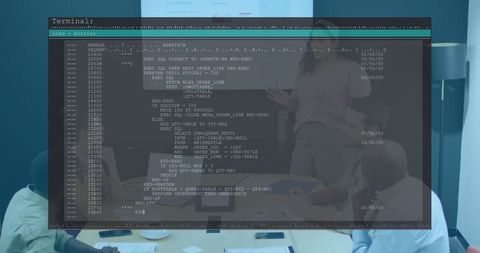
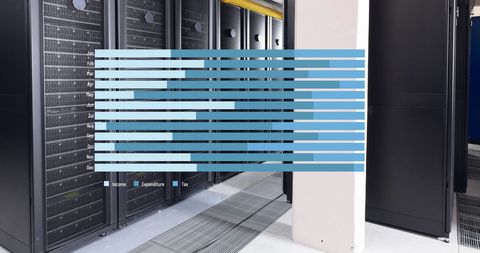
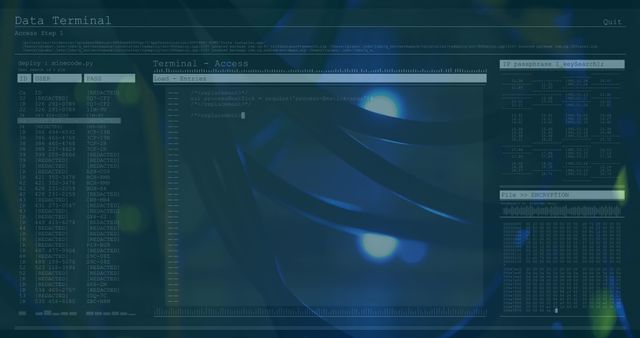
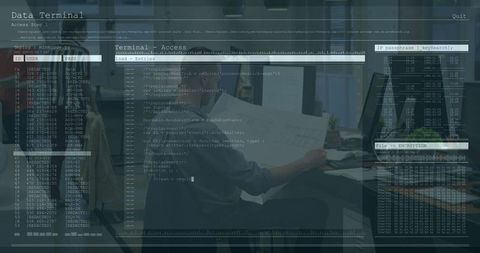
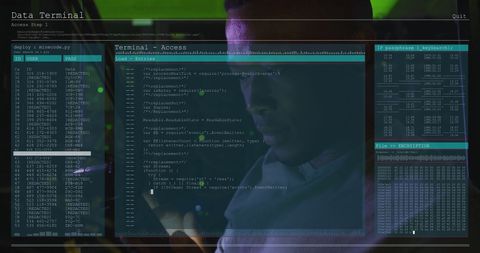
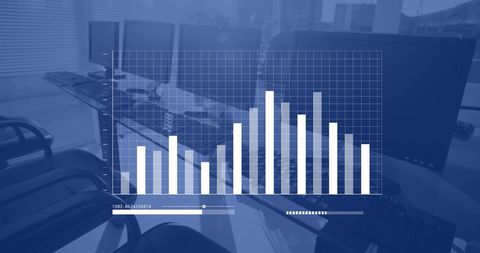
- Data Visualization Overlaid on Office Computers in Modern Workspace
Data Visualization Overlaid on Office Computers in Modern Workspace Image

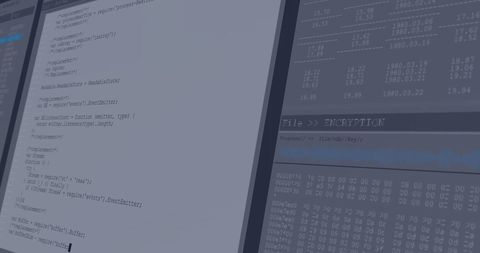
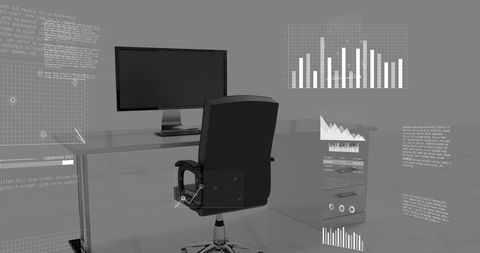
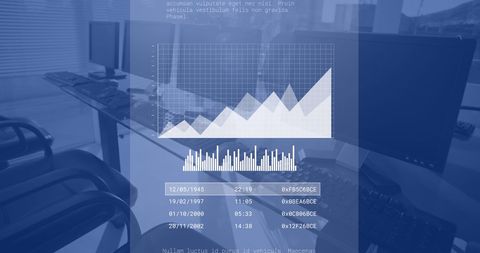
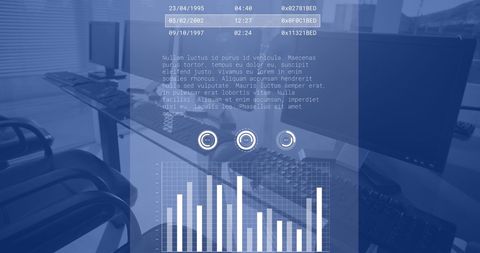
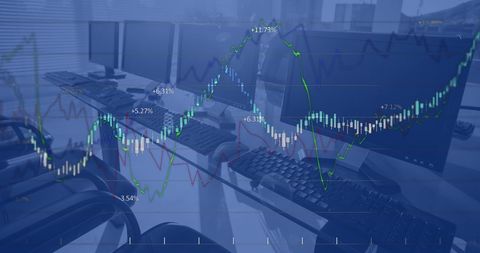
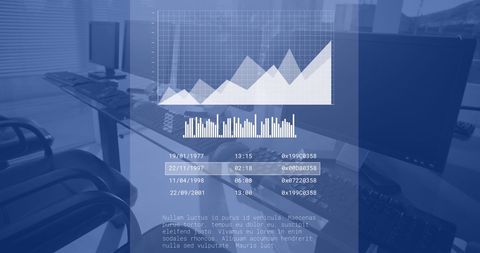
This stock photo features a digital overlay of a blue and white bar graph displaying monthly financial data, including income, expenditure, and tax. The graph is superimposed over office computers in a clean, modern workspace. Ideal for use in business presentations, financial analysis reports, blog articles on data utilization, or illustrating technology in office settings.
Powered by 


downloads
Tags:
More
Credit Photo
If you would like to credit the Photo, here are some ways you can do so
Text Link
photo Link
<span class="text-link">
<span>
<a target="_blank" href=https://pikwizard.com/photo/data-visualization-overlaid-on-office-computers-in-modern-workspace/2837feae4e596027ffdb4391c55ea0aa/>PikWizard</a>
</span>
</span>
<span class="image-link">
<span
style="margin: 0 0 20px 0; display: inline-block; vertical-align: middle; width: 100%;"
>
<a
target="_blank"
href="https://pikwizard.com/photo/data-visualization-overlaid-on-office-computers-in-modern-workspace/2837feae4e596027ffdb4391c55ea0aa/"
style="text-decoration: none; font-size: 10px; margin: 0;"
>
<img src="https://pikwizard.com/pw/medium/2837feae4e596027ffdb4391c55ea0aa.jpg" style="margin: 0; width: 100%;" alt="" />
<p style="font-size: 12px; margin: 0;">PikWizard</p>
</a>
</span>
</span>
Free (free of charge)
Free for personal and commercial use.
Author: Creative Art
Similar Free Stock Images

Premium


Premium


Premium


Premium


Premium


Premium


Premium


Premium


Premium

Premium


Premium

Premium


Premium

Premium


Premium

Premium

Premium


Premium

Premium

AI


Premium


Premium

Premium


Premium


Premium


Premium


Explore More Free Stock Images