
- Home >
- Stock Photos >
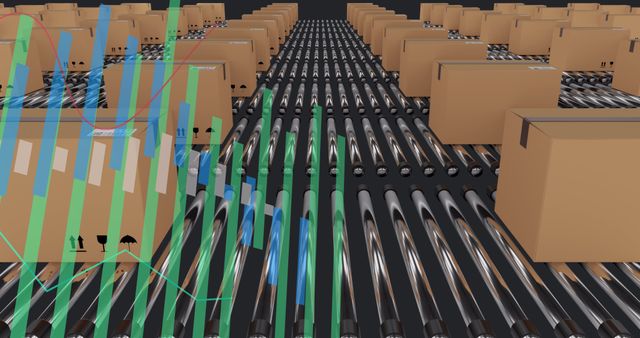
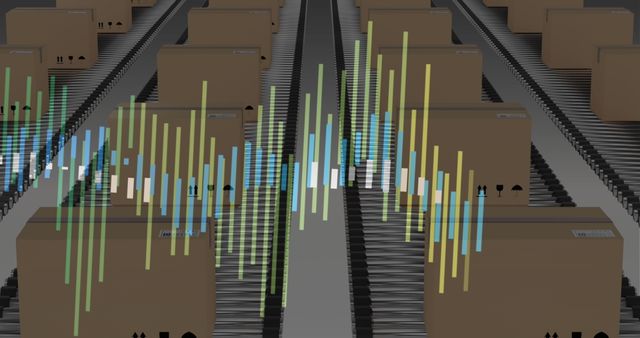
- Data Visualization Overlapping Cardboard Boxes in Shipping
Data Visualization Overlapping Cardboard Boxes in Shipping Image
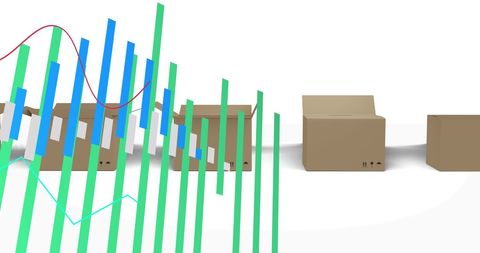
Graphic illustrates intersection of data analytics and logistics by showing abstract lines and graphs superimposed on brown cardboard boxes. Useful for presentations or articles on supply chain analytics, global distribution strategies, and manual product tracking improvements.
Powered by  - Get 15% off with code: PIKWIZARD15


downloads
Tags:
More
Credit Photo
If you would like to credit the Photo, here are some ways you can do so
Text Link
photo Link
<span class="text-link">
<span>
<a target="_blank" href=https://pikwizard.com/photo/data-visualization-overlapping-cardboard-boxes-in-shipping/d9d4e3be8fec8f9f11062f0b1f61fb93/>PikWizard</a>
</span>
</span>
<span class="image-link">
<span
style="margin: 0 0 20px 0; display: inline-block; vertical-align: middle; width: 100%;"
>
<a
target="_blank"
href="https://pikwizard.com/photo/data-visualization-overlapping-cardboard-boxes-in-shipping/d9d4e3be8fec8f9f11062f0b1f61fb93/"
style="text-decoration: none; font-size: 10px; margin: 0;"
>
<img src="https://pikwizard.com/pw/medium/d9d4e3be8fec8f9f11062f0b1f61fb93.jpg" style="margin: 0; width: 100%;" alt="" />
<p style="font-size: 12px; margin: 0;">PikWizard</p>
</a>
</span>
</span>
Free (free of charge)
Free for personal and commercial use.
Author: Awesome Content
Similar Free Stock Images

Premium


Premium

Premium


Premium


Premium


Premium

Premium

Premium

Premium


Premium


Premium

Premium

Premium


Premium


Premium


Premium


Premium


Premium


Premium


Premium


Premium

Premium


Premium


Premium


Premium

Explore More Free Stock Images