
- Home >
- Stock Photos >
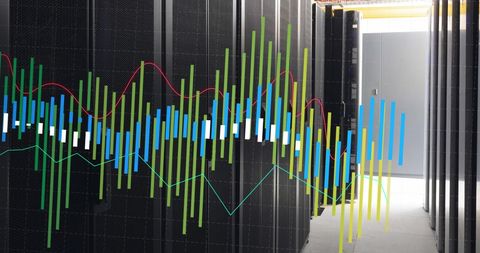
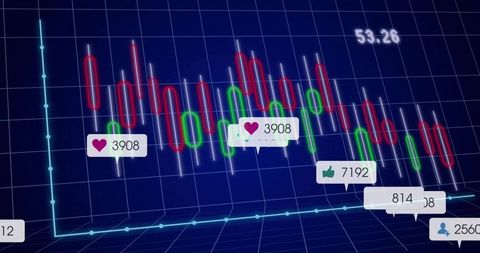
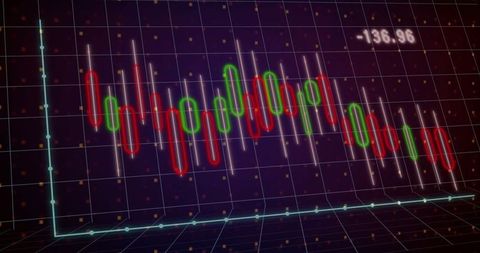
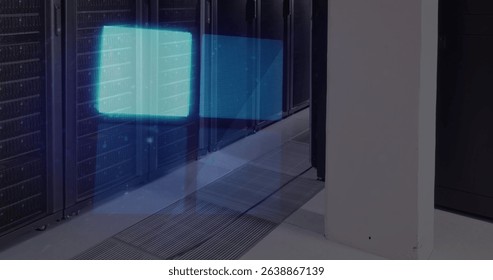
- Data Visualization Overlay in Dark Computer Server
Data Visualization Overlay in Dark Computer Server Image

Colorful graphs overlay in a dark computer server setting depict data processing, ideal for illustrating concepts related to information technology, computer networks, and analytics. Useful for web platforms discussing data management solutions or newsletters on technology trends.
Powered by  - Get 15% off with code: PIKWIZARD15


downloads
Tags:
More
Credit Photo
If you would like to credit the Photo, here are some ways you can do so
Text Link
photo Link
<span class="text-link">
<span>
<a target="_blank" href=https://pikwizard.com/photo/data-visualization-overlay-in-dark-computer-server/a51581b38023f7bea2d96aa6b328999c/>PikWizard</a>
</span>
</span>
<span class="image-link">
<span
style="margin: 0 0 20px 0; display: inline-block; vertical-align: middle; width: 100%;"
>
<a
target="_blank"
href="https://pikwizard.com/photo/data-visualization-overlay-in-dark-computer-server/a51581b38023f7bea2d96aa6b328999c/"
style="text-decoration: none; font-size: 10px; margin: 0;"
>
<img src="https://pikwizard.com/pw/medium/a51581b38023f7bea2d96aa6b328999c.jpg" style="margin: 0; width: 100%;" alt="" />
<p style="font-size: 12px; margin: 0;">PikWizard</p>
</a>
</span>
</span>
Free (free of charge)
Free for personal and commercial use.
Author: Authentic Images
Similar Free Stock Images

Premium


Premium


Premium

Premium


Premium


Premium

Premium


Premium


Premium


Premium


Premium

AI


Premium


Premium


Premium


Premium


Premium


Premium


Premium


Premium


Premium


Premium

Premium


Premium


Premium


Premium

Explore More Free Stock Images