- Home >
- Stock Photos >
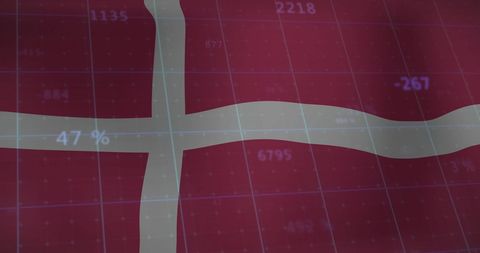
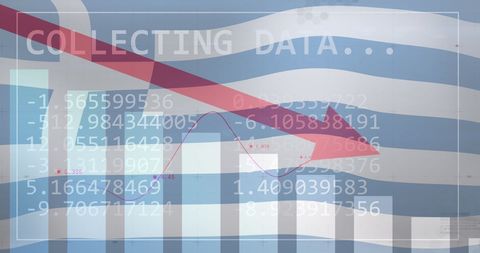
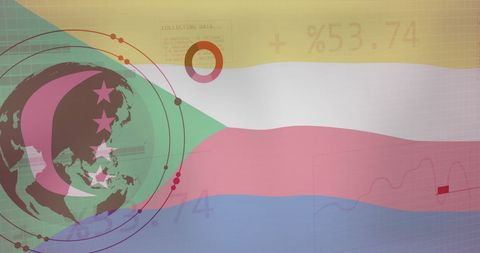
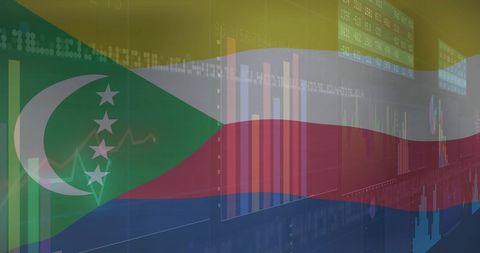
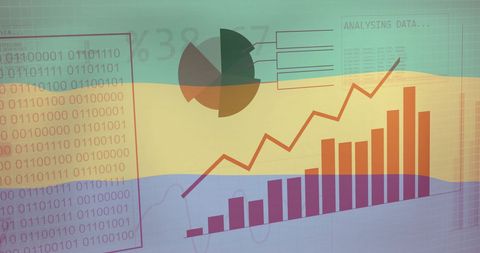
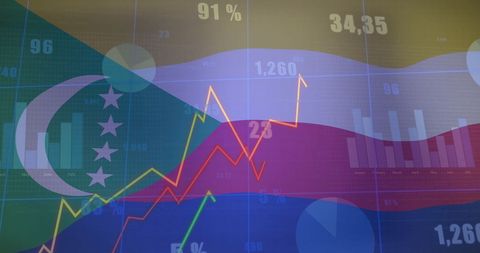
- Data Visualization Overlay on Reunion Region Flag Background
Data Visualization Overlay on Reunion Region Flag Background Image
Colorful graphs and charts displayed over a stylized representation of the Reunion flag, blending themes of data analysis with regional identity. Great for illustrating concepts of progress, technology integration, and economics in a cultural or geographical context. Useful for presentations on data-driven insights in Reunion, or articles discussing technological growth in the regional economy.
Powered by 


downloads
Tags:
More
Credit Photo
If you would like to credit the Photo, here are some ways you can do so
Text Link
photo Link
<span class="text-link">
<span>
<a target="_blank" href=https://pikwizard.com/photo/data-visualization-overlay-on-reunion-region-flag-background/f8b6f43cccee3a8e81897ef4f8d07cfd/>PikWizard</a>
</span>
</span>
<span class="image-link">
<span
style="margin: 0 0 20px 0; display: inline-block; vertical-align: middle; width: 100%;"
>
<a
target="_blank"
href="https://pikwizard.com/photo/data-visualization-overlay-on-reunion-region-flag-background/f8b6f43cccee3a8e81897ef4f8d07cfd/"
style="text-decoration: none; font-size: 10px; margin: 0;"
>
<img src="https://pikwizard.com/pw/medium/f8b6f43cccee3a8e81897ef4f8d07cfd.jpg" style="margin: 0; width: 100%;" alt="" />
<p style="font-size: 12px; margin: 0;">PikWizard</p>
</a>
</span>
</span>
Free (free of charge)
Free for personal and commercial use.
Author: People Creations