1. Home > 
  2. Stock Photos > 
  3. Data Visualization Social Media Interaction Concept

Data Visualization Social Media Interaction Concept Image

Data Visualization Social Media Interaction Concept

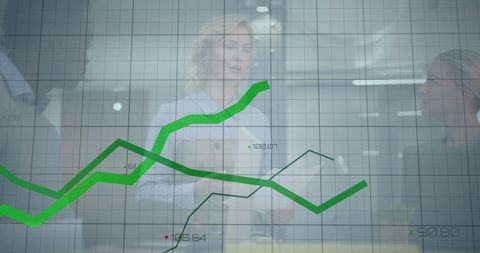
Digitized display of social media interactions such as message sent, subscribed, and friend added overlaid on data graphs and charts. This image represents the concept of integrating social media engagement metrics with real-time data processing. It is ideal for tech blogs, social media strategy presentations, digital marketing visuals, and articles focusing on data-driven business decisions.

Powered by Adobe logo
Businessman analyzing using tab data on digital marketing. SEO analytics, social media strategy, online advertising, conversion optimization, and content engagement metrics. - Powered by AdobeVisual representation of digital marketing metrics and ads on a futuristic interface, showcasing data analysis through charts and graphs in a modern business setting. Gantry - Powered by AdobePerson hand touching virtual digital marketing dashboard with glowing neon icons for growth analytics data strategy business success and social media optimization on dark background - Powered by AdobeLaptop with virtual social media analytics and engagement icons - Powered by Adobesearch engine optimization concept with magnifying glass and digital data analysis icons. - Powered by Adobe

Credit Photo

If you would like to credit the Photo, here are some ways you can do so

Free (free of charge)

Free for personal and commercial use.

Author: People Creations

Similar Free Stock Images

Financial Data Analysis with Dynamic Growth Charts
Premium
Social Media Analytics and Marketing Dashboard with Data Visualization and Growth Statistics Hologram
Rising Data Graph with Changing Numbers on Blue Grid
Premium
AI-Powered Marketing Integration Concept
Premium
A business professional holding an open hand with colorful icons representing people and social connections above it, symbolizing networking and community
Green Line Graph on Grid Interface Displaying Financial Data Trends
Declining Stock Market Trends with Digital World Map
Dynamic Financial Data Graph Visualization on Black Background
Abstract Financial Chart With Green Line Graphs
Red Financial Data Graphic on Grid with Arrow Trendline
Abstract Digital Graph with Data Visuals and Scope Interface
Crypto Market Growth and Analysis Graph
Green Line Graph Over Digital Grid Highlighting Data Trends
Premium
3D rendering of a data visualization dashboard with graphs and charts, a laptop computer displaying social media marketing analytics on the screen, against a dark background with focused lighting,
Premium
Digital marketing strategy and communication concept using tablet businessman using digital pen to create content social media search engine optimization email marketing and
Falling Line Graph Illustrates Decreasing Financial Trends
Descending Trend Graph on Pink Gradient Background
Dynamic Data Trends on Digital Display for Financial Analysis
Futuristic Stock Market Concept with Social Media Integration
Colorful Graphs Indicating Financial Data Analysis Over Grid Background
Colleagues Discuss Financial Data with Digital Graph Overlay
Dynamic Financial Data Analysis on Graph
Data Analytics Graph and Technology Interface
Data Visualization Digital Chart Display on White Background
Data-Driven Team with Rising Growth Charts
Premium
Vector illustration of a mobile phone with a business graph and social media icons set representing a modern communication technology concept for internet web design
Futuristic HUD cockpit displaying holographic telemetry, navigation and green performance graph
Digital Financial Data Processing on Grey Grid Background
Dynamic Data Visualization with Green Graph Lines on White Background
Stylized Dashboard Displaying Colored Data Analytics Line Graphs
Premium
Digital dashboards displaying data analytics and social media icons on a dark background.
Dynamic Numeric Data Streaming on Digital Grid Network
Stock Market Trends with Upward and Downward Graph
Digital Interface with Graphs and Notification Alerts
Dynamic Financial Data Chart with Red Trend Line on Green Background
Digital Green Graph Lines on Grid Showing Business Analytics
Declining Financial Chart with Red Lines on Data Grid
Premium
A person interacting with social media, highlighting engagement metrics and performance analysis. A person appears to be using augmented reality to monitor his social media
Premium
Business icons for marketing and productivity tools
Premium
Wooden cubes labeled 'SEO' and 'SEM' on table, representing search optimization, marketing strategy, analytics, growth, performance
Premium
Global network technology concept man using smartphone with world map hologram connection data transfer
Dynamic Green Line Graph on Digital Dashboard
Dynamic Notification Interface with Stocks and Social Media Alerts
Financial Growth Analysis During Business Meeting
Financial Market Decline Illustrated on Grid Chart
Financial Data Visualization with Green Graph Line on Blue Background
Growing Success Trend with Data Chart over Pink Gradient
Digital Graphs and Global Data Interface Concept
Dynamic Statistical Graphs on Gradient Background
Premium
Boost your business with effective pay per click advertising strategy using PPC campaigns to drive targeted traffic and increase your online presence now
Rising Financial Graphs with Hand Gesture Interaction
Dynamic Charts and Lines Displaying Financial Data Trends
Biometric Analysis with Financial Data Overlay
Rising Green Graph on Financial Data Grid Background
Declining Financial Graph on Grid Background
Data Trends Visualization Over Virus Background
Displaying Blue Trend Lines on Grid Analytics Dashboard with Markers and Data Values
Green Financial Data Chart with Technological Overlay
Falling Statistics with Red Graph on Digital Interface
Premium
Increase your social media engagement with these simple tips and tricks for boosting likes, comments, and shares on your posts and stories.
Dynamic Financial Growth Trends with Analytics Visualization
Digital Interface Displaying Social Media Engagement over Stock Trends
Dynamic Stock Market Trends and Data Visualization
Futuristic Digital Data Dashboard with Rising Line Graph
Premium
A professional businessman interacts with a digital interface displaying key elements of modern digital marketing strategies including seo social media and web analytics
Futuristic Data Analysis Interface with Green Trend Lines
Green Line Graph Showing Upward Financial Trends and Growth
Digital Interface with Financial Data and Graphs on Black Background
Futuristic Green Line Graph Over Global Data Charts
Digital Interface with Data Graphs and Media Icons
Global Financial Growth Analysis with Digital Graphs and Map
Complex Data Analysis with Interactive Charts and Arrows
Fluctuating Financial Trends and Market Analysis
Vivid Line Graphs Over Cityscape Grid on Data Dashboard
Abstract Financial Data Visualization on Purple Grid
Dynamic Green Line Graph on Data Grid Background
Digital Financial Graphs Overlapping Modern Office Scene
Financial Growth Concept with Green Upward Line Graph
Premium
Close-up of a hand holding a magnifying glass with various social media icons floating above it against a dark background.
Dynamic Zigzag Line Chart Analytics Display with Gradient Bars
Financial Downtrend and Data Analysis Concept
Abstract Financial Data Visualization with Dynamic Graphs
Professional Team Discussing Financial Growth with Line Graph Overlays
Premium
This image features a robotic hand pointing at an SEO analytics dashboard, showcasing data graphs and social media icons, perfect for technology and marketing themes. Synapse
Premium
Businessman analyzing social media engagement metrics on holographic laptop screen
Premium
Young African American businesswoman analyzing digital social media network icons and data visualization in modern tech office environment.
Premium
Person analyzes social media metrics on laptop screen displaying graphs, charts, icons. Engagement, communication, performance statistics visible on dashboard. Business strategy, data analysis,
Digital Data Display in Modern Office on Virtual Grid
Dynamic Grid of Changing Numbers on Blue Background
Digital Data Analysis Concept with Graph on Grid Background
Dynamic Growth Over Time on Grid Background
Premium
Digital advertising concept. Woman using mobile phone and laptop. Online ads, data analytics dashboard, ecommerce business growth strategy. Modern technology for online campaign performance tracking.
Abstract Digital Data Grid With Streaming Numbers
Dynamic Stock Market Analysis with Data and Trends Visualization
Dynamic Data Trends Over Digital Graph with Pink Background
Dynamic Chart and Globe Depict Global Financial Movement
Abstract Digital World Map with Business Diagrams
Graph Visualizing Economic Downtrend and Financial Data
Rising Green Graph Lines over Business Data
Economic Data Visualization of Chad Flag Colors
Green Line Processing Over Clock with Business Analytics
Abstract Digital Art of Purple Shapes on Textured Blue Background
Abstract Financial Chart with Declining Red Lines
Rising Green Line on Financial Digital Display
Premium
Business professional holding a glowing sphere with connected icons symbolizing networking and communication in the digital age showcasing innovation and technology leadership
Premium
Businessman analyzing data science and AI analytics on futuristic virtual touchscreen interface
Rising Graph Line Over Digital Grid Background
Circuitry and Data Stream on Digital Grid Background
Ascending Green Line Graph Overlay on Urban Skyline for Business Growth Concept
Digital Data Visualization Chart with Trend Lines
Premium
Businessman touching virtual megaphone icon,concept of digital marketing,advertising strategy,public relations,social media promotion,brand awareness and customer targeting.
Beveled Green Trend Line Moving Across Dark Blue Grid Showing Market Data Visualization
Declining Graph Illustrating Business Loss and Reduction Concept
Financial Data and Growth Arrows Boosting Business Success
Rising Financial Statistics on Digital Grid Background
Dynamic Green Business Data Graph with Office Backdrop
Dynamic Graph Lines Over Digital Grid Background
Data Center with Rising Trends on Digital Graph
Dynamic Financial Dashboard Depicting Business Analytics
Financial Graph Overlay on Diverse Team in Business Setting
Premium
Person boosting social media post with increased reach and engagement metrics
Red Line Graph Showing Financial Decline on Grid Background
Rising Green Lines Signifying Financial Growth
Dynamic Financial Chart with Currency Symbols and Digital Network
Premium
Businessman analyzing using tab data on lead generation. Marketing analytics, conversion optimization, audience targeting, sales funnel, and digital growth strategy.
Explore More Free Stock Images