1. Home > 
  2. Stock Photos > 
  3. Data Visualization Through Server Lights in High-Tech Environment

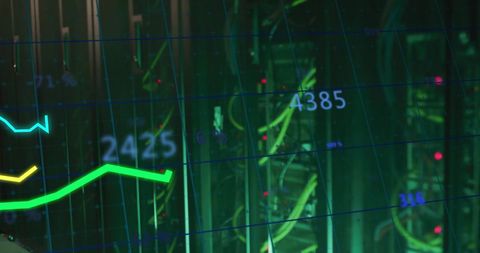
Data Visualization Through Server Lights in High-Tech Environment Image

Data Visualization Through Server Lights in High-Tech Environment

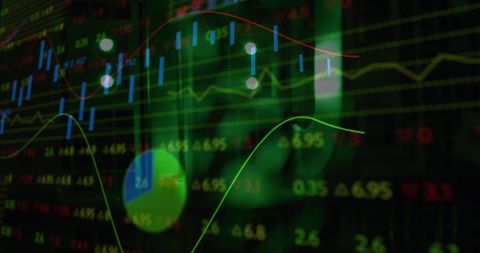
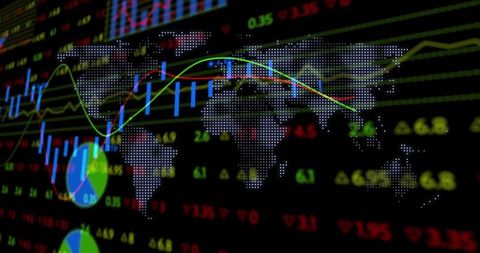
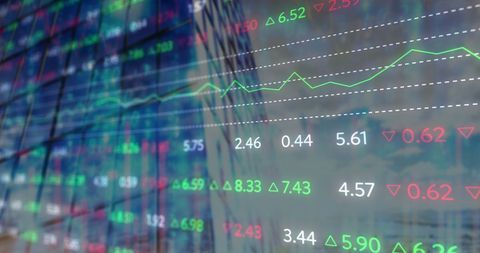
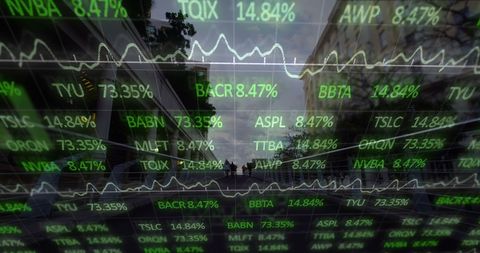
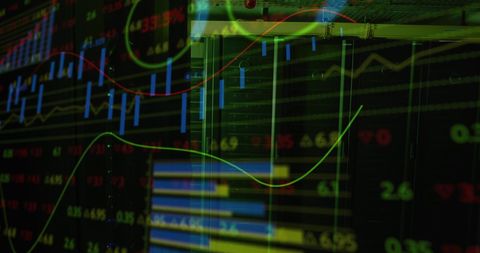
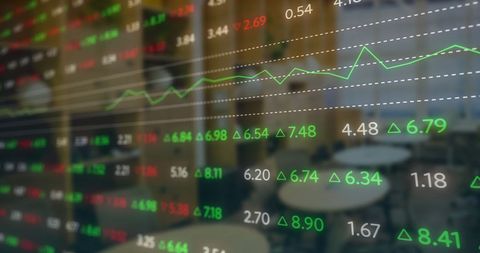
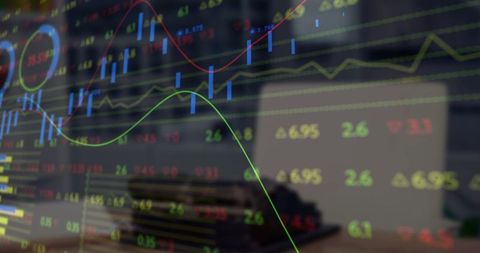
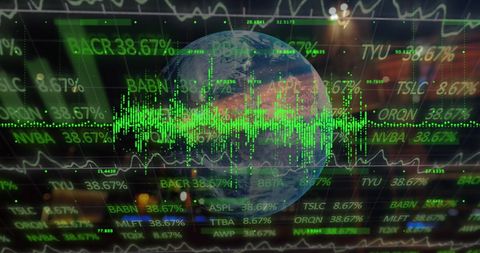
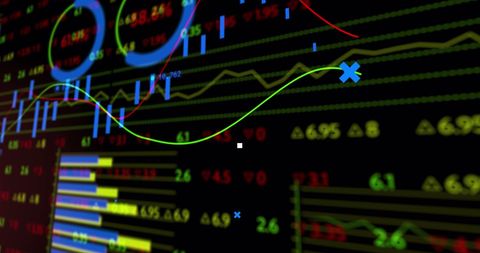
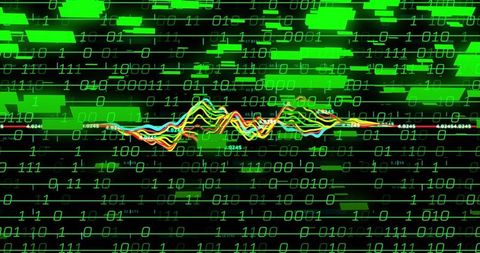
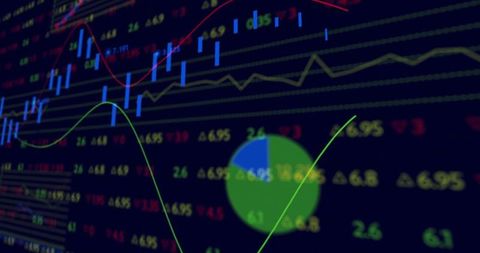
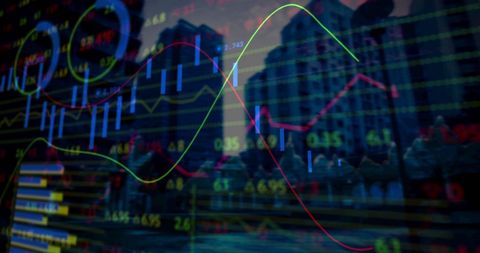
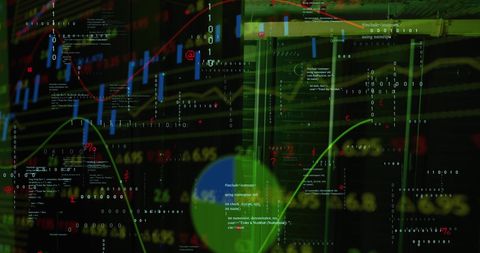
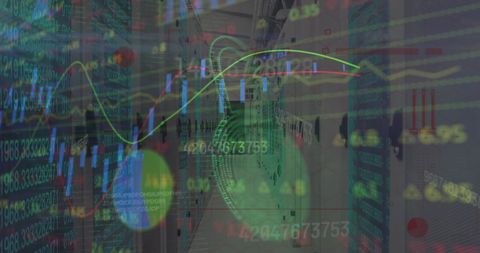
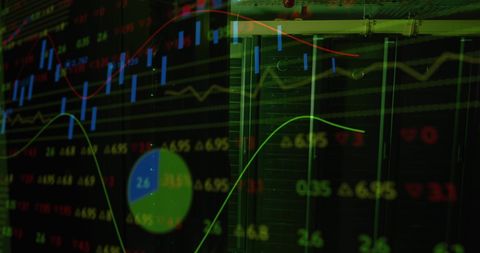
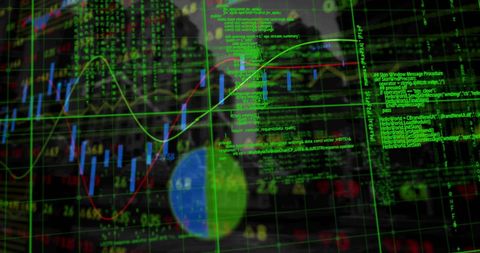
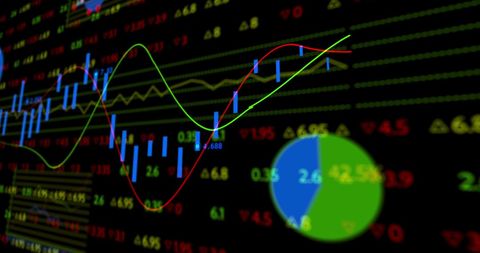
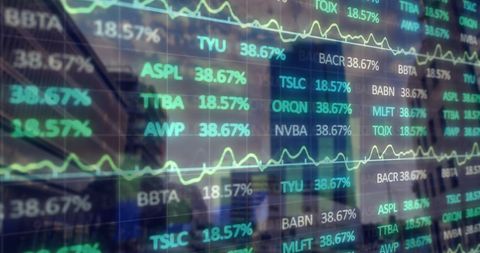
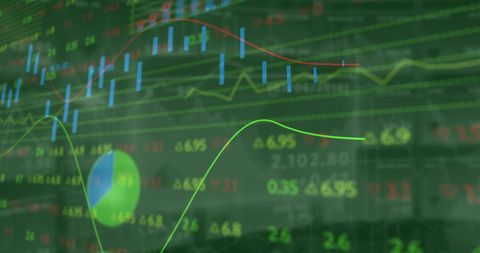
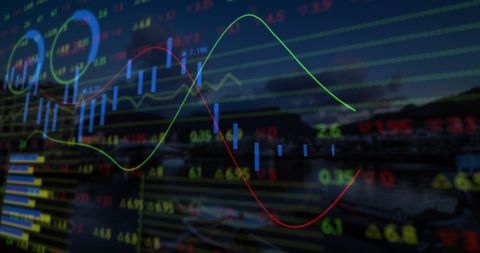
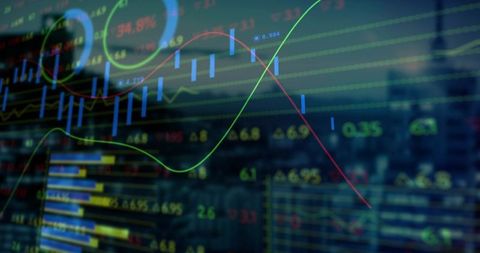
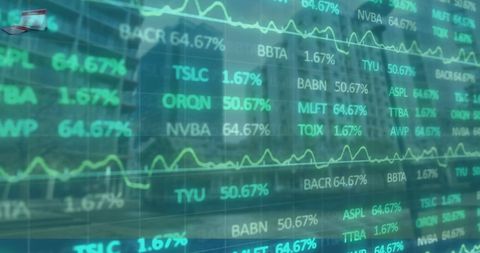
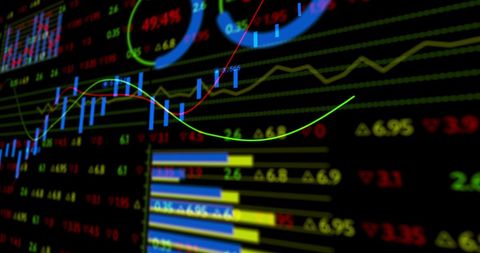
Digital graphical representation of statistics over glowing server lights evokes themes of modern data processing and cloud computing. This visual is ideal for illustrating articles about technology trends, data analysis, and IT solutions. Perfect for use in presentations or reports focusing on cyber infrastructure or tech innovations.

Powered by Shutterstock logo - Get 15% off with code: PIKWIZARD15
Displaying server racks featuring cables and LEDs in data center, with holographic data overlays. Technology, networking, cybersecurity, innovation, futurism, precision, infrastructure - Powered by Shutterstock - Get 15% off with code: PIKWIZARD15Reskill upskill IT job workforce remote support examine web page server cloud computing concept. POV people IOT work night dark blue light show text idea on woman face wear VR goggle. Hacker crime. - Powered by Shutterstock - Get 15% off with code: PIKWIZARD15Displaying world map overlay showing markers in data center, with line chart and LED-lit cabinets. Technology, analytics, cybersecurity, visualization, enterprise, innovation, digital - Powered by Shutterstock - Get 15% off with code: PIKWIZARD15Data charts image over server room with green lighting and cables. Technology, cybersecurity, networking, digital, communication, information - Powered by Shutterstock - Get 15% off with code: PIKWIZARD15Image of financial data processing with light trails over server room. Global technology, finances, computing and digital interface concept digitally generated image. - Powered by Shutterstock - Get 15% off with code: PIKWIZARD15

Credit Photo

If you would like to credit the Photo, here are some ways you can do so

Free (free of charge)

Free for personal and commercial use.

Author: Authentic Images

Similar Free Stock Images

Stock Exchange Data with Dynamic Graphs and Chart Display
Premium
Image of data processing and statistics recording over green lights of computer servers. data processing, cloud computing concept and technology concept digitally generated image.
Digital Finance Data Security with Fingerprint Technology
Digital Data Processing with Virtual Interface in Server Room
Digital Data Processing with Server Overlay Visuals
Digital Data Visualization with Abstract Technology Interface
Financial Data and Dynamic Cityscape: Merging Economy and Technology
Dynamic Financial Data Visualization On Green Background
Stock Market Graph Overlay with Digital Interface Effects
Global Financial Data and Stock Market Analytics
Dynamic Stock Market Trends with Urban Landscape
Financial Data Overlay on Cityscape Highlighting Global Markets
Digital Financial Data with Rising Trends Display
Global Business and Digital Interface Concept
Dynamic Financial Data and Online Security Visualization
Financial Data Overlay on Computer Servers Illustrating Global Business Trends
Digital Financial Chart Overlaying Cityscape Skyscrapers
Digital Stock Market Data Overlay on City Skyline
Financial Data on Glass Screen in Modern Office
Global Data Visualization with Financial Metrics and World Map
Digital Display of Stock Market Trends with Graphs and Numbers
Abstract Financial Data Visualization in Urban Setting
Digital Data Processing with Line Graph Overlay in Server Room
Digital Data Analysis with Futuristic Diagrams in Celebration Office
Dynamic Financial Chart Display with Candlestick Patterns and Trend Lines
City Skyline with Market Data Dashboard and Metrics
Dynamic Stock Exchange Analysis with Moving Financial Graphs
Financial Data Overlapping Cityscape Represents Global Business Concepts
Premium
Background big data visualization futuristic technology. Hand touch digital screen hologram sign on city light blurred background
Abstract Digital Interface Over Green Data Server Lights
Stock Market Data Graphics on Modern Building Background
Abstract Financial Data Graphs on Digital Display
Stock Market Data with Digital Interface Background
Abstract Financial Data Analysis with Dynamic Graphs on Green
Digital Interface with Financial Data Displayed on Screen
Dynamic Stock Market Data Visualization
Financial Data Graphs Reflecting on Urban Skyline
Financial Data Overlayed on Urban Cityscape Representing Global Markets
Stock Market Graphs Overlaying Urban Cityscape at Dusk
Stock Market Data Overlaid on Urban Construction Scene
Construction Site Merged with Digital Financial Graph Overlay
Futuristic Financial Data Analysis with Dynamic Charts and Graphs
Dynamic Stock Market Graph on Digital Grid Background
Data Processing and Server Room with Global Business Interface
Stock Market Data on Digital Screen with Glowing Chart Loops
Dynamic Stock Market Graphs Show Financial Analytics and Trends
Fluctuating Stock Index with Confidence Building Trends
Digital Financial Data Overlaid on Urban Cityscape Symbolizing Global Business
Digital Data Processing Concept in Green Background
Dynamic Stock Market Analysis with Candlestick Data Chart
Stock Market Analytics on Digital Trading Screen
Businessman Analyzing Financial Data Displays in Office Setting
Dynamic Financial Data on Digital Stock Market Interface
Futuristic Financial Data on Transparent Cityscape
Digital Financial Data on Glowing Server Background
Premium
Businessman holding light bulb with business analysis icon for market research concept. Strategy of investment and finance, analytics dashboard, Development and data analysis for business growth.
Data Transmission Over Server Room with Digital Overlay
Stock Market Index Showing Financial Data and Trends
Dynamic Financial Growth Arrow with Data Overlay
Abstract Financial Data and Green Market Graphs Overlay
Blurred Cityscape Stock Market Data Overlay
Dynamic Stock Market Data Visualization with Global Financial Indicators
Digital Financial Data Overlaying Illuminated Cityscape
Digital Network Connections Visualization with Data Analysis Graphs
Global Data Processing with Stock Market Visualization Overlay
Financial Data Overlapping Crane and Construction Site During Global Development
Colorful Stock Market Data with Infographics
Stock Market Graphs Superimposed on Modern Office Hallway
Dynamic Stock Market Data Display with Growth Indicators
Global Financial Data and Analytics Concept
Stock Market Analysis with Global Data Visualization
Digital Padlock Over Financial Data Illustrating Cybersecurity Protection
Global Financial Market Stocks and Cyphers on Digital Chart
Digital Financial Data on Cityscape Background
Dynamic Financial Data Analysis Concept over Cityscape
Futuristic Binary Data with Candlestick Chart Analysis
Financial Market Data with Stock Candlestick Chart and Indicators
Overlaying Candlestick Charts on Urban Office Skyline Featuring Neon Trading Indicators
Abstract Financial Data Over City Silhouette Representation
Cybersecurity Data Analysis and Encrypted Connections
Abstract Digital Data Chart on Computer Server Background
Digital Interface and Data Processing over Server Lights
Premium
Reskill upskill IT job workforce remote support examine web page server cloud computing concept. POV people IOT work night dark blue light show text idea on woman face wear VR goggle. Hacker crime.
Abstract Image of Digital Financial Data on Transparent Screen
Digital Stock Market Analysis on Green Background
Navigating Stock Market Trends through Digital Analytics
Global Stock Market Data Overlays With Skyscraper Background
Dynamic Stock Market Data Overlaying Urban Landscape
Digital Stock Market Display with Growing Market Data
Dynamic Financial Charts with Colorful Data Visualization
Global Financial Markets Data Background with Digital Graphs
Fluctuating Stock Market Prices and Data Display
Dynamic Stock Market Data and Digital Interface Concept
Dynamic Stock Market Financial Data on Digital Display
Abstract Stock Market Data Visualization with Charts and Figures
Global Business Data Processing with Digital Interface Overlay
Dynamic Stock Market Data Display with Vibrant Graph Overlays
Stock Market Data Overlaid on Urban Business Skyline
Abstract Financial Data Visualization with Digital Interface
Global Financial Data Reflecting Business Trends
Dynamic Stock Market Analytics with Data Visualization
Financial District with Market Trends Overlay and Analytics Graphics
Global Financial Data Visualization: Dotted Maps with Market Trends
Biometric Fingerprint Overlaying Financial Market Data with Candlestick Charts and Code