- Home >
- Stock Photos >
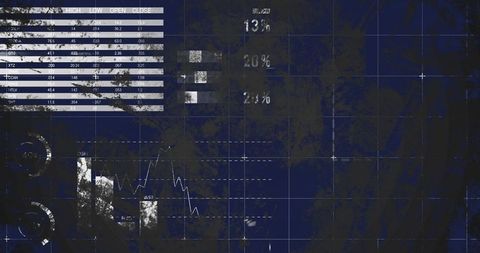
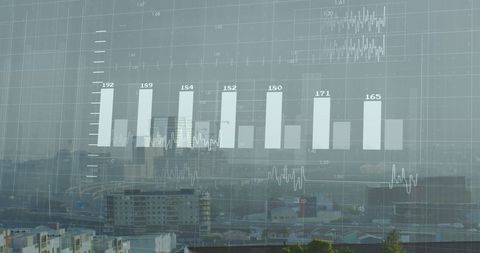
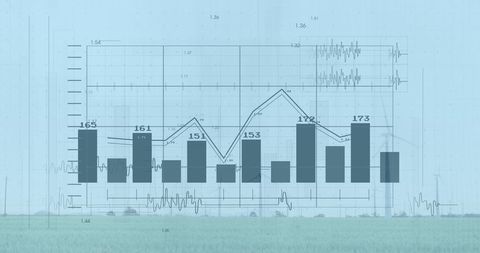
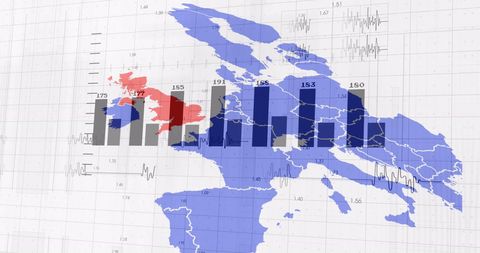
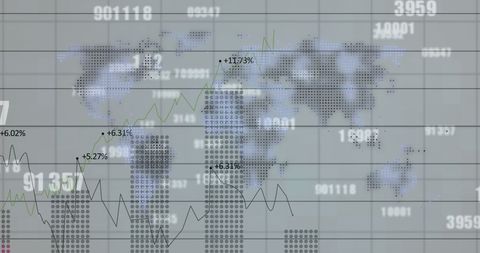
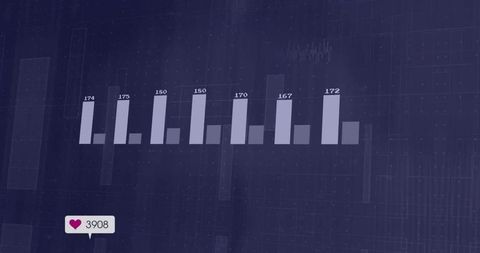
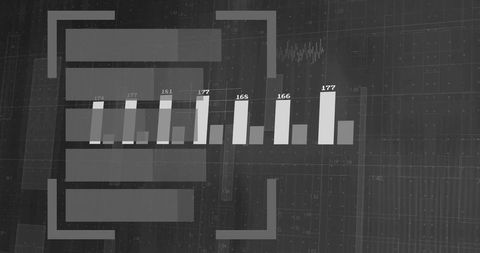
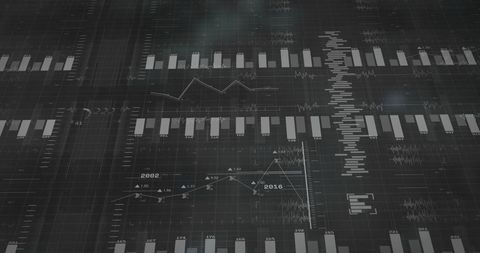
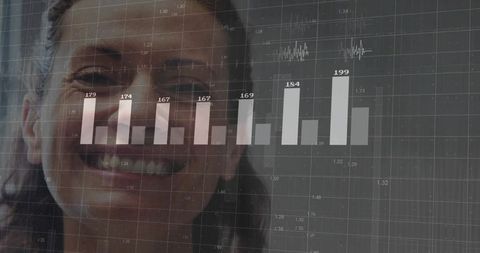
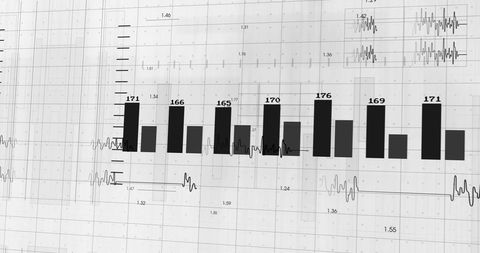
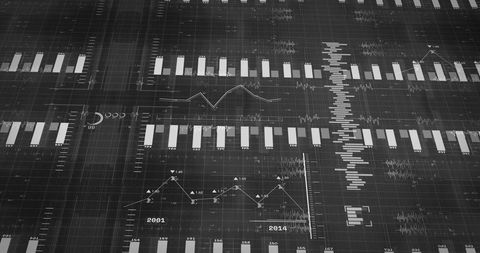
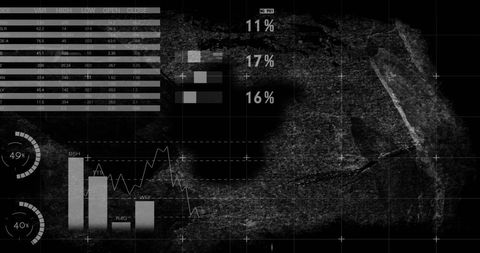
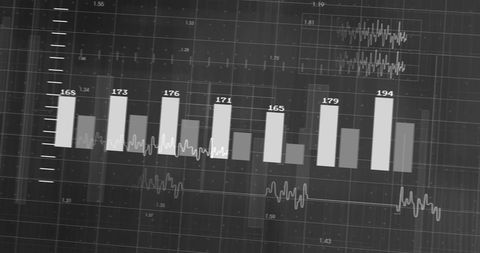
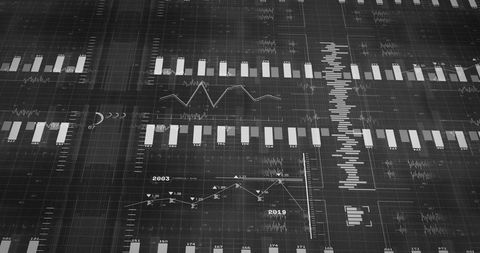
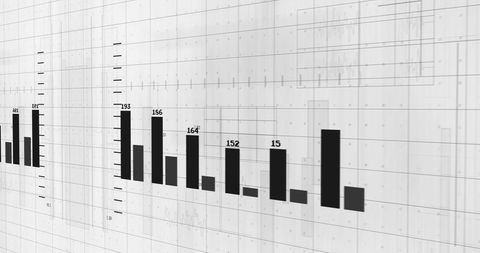
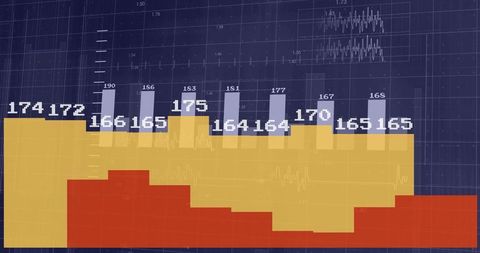
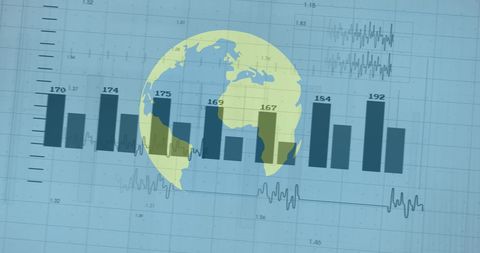
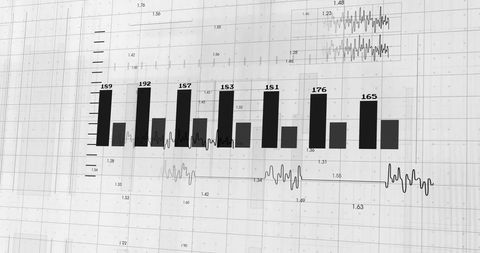
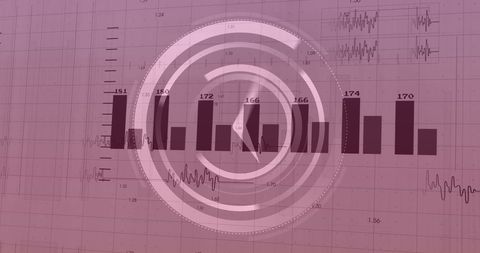
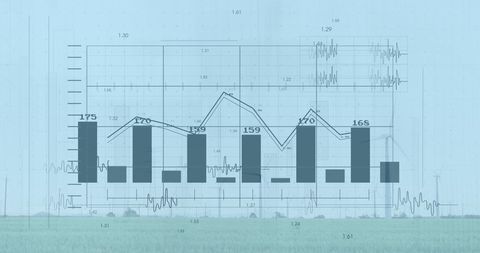
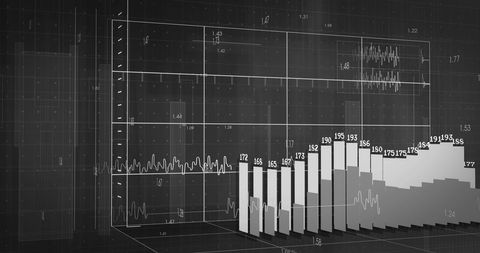
- Data Visualization with Bar Graph and Dark Interface
Data Visualization with Bar Graph and Dark Interface Image
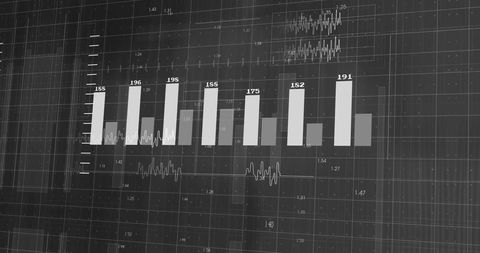
Abstract design featuring numerical data represented on a bar graph, superimposed on a digital black background. Ideal for illustrating concepts related to data analysis, statistics, and modern digital interfaces. Perfect for use in presentations or articles discussing technology, financial reporting, or business strategy development.

downloads
Tags:
More
Credit Photo
If you would like to credit the Photo, here are some ways you can do so
Text Link
photo Link
<span class="text-link">
<span>
<a target="_blank" href=https://pikwizard.com/photo/data-visualization-with-bar-graph-and-dark-interface/2772662f8cc418c3e71bcd77c60b3cd3/>PikWizard</a>
</span>
</span>
<span class="image-link">
<span
style="margin: 0 0 20px 0; display: inline-block; vertical-align: middle; width: 100%;"
>
<a
target="_blank"
href="https://pikwizard.com/photo/data-visualization-with-bar-graph-and-dark-interface/2772662f8cc418c3e71bcd77c60b3cd3/"
style="text-decoration: none; font-size: 10px; margin: 0;"
>
<img src="https://pikwizard.com/pw/medium/2772662f8cc418c3e71bcd77c60b3cd3.jpg" style="margin: 0; width: 100%;" alt="" />
<p style="font-size: 12px; margin: 0;">PikWizard</p>
</a>
</span>
</span>
Free (free of charge)
Free for personal and commercial use.
Author: Creative Art