- Home >
- Stock Photos >
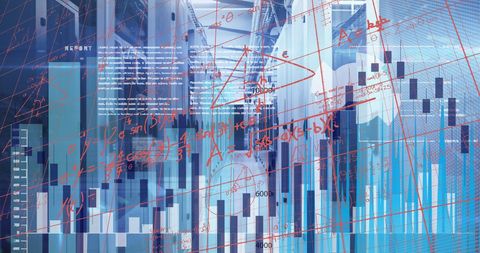
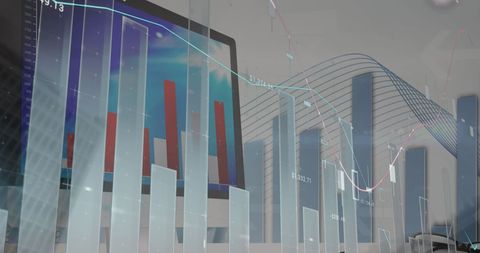
- Data Visualization with Code and Dynamic Light Effects
Data Visualization with Code and Dynamic Light Effects Image

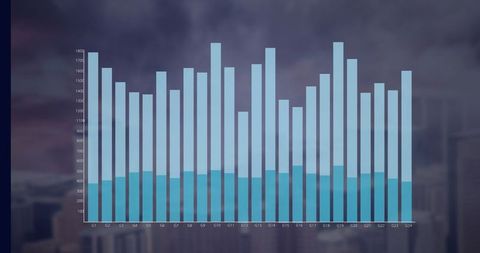
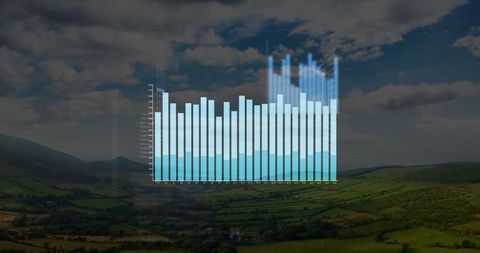
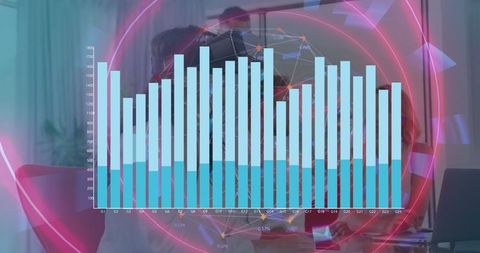
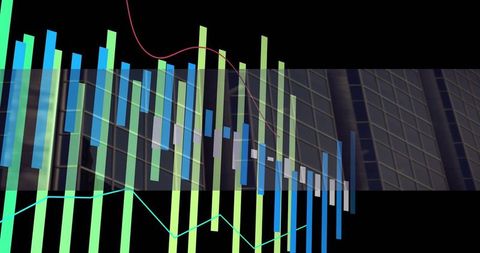
Glowing digital display of data visualization overlaid with programming code illustrates the convergence of technology and analytics. Dynamic light effects represent fast information transfer and connectivity. Ideal for use in representations of digital transformation, software development, global data exchange, or technology conferences.

downloads
Tags:
More
Credit Photo
If you would like to credit the Photo, here are some ways you can do so
Text Link
photo Link
<span class="text-link">
<span>
<a target="_blank" href=https://pikwizard.com/photo/data-visualization-with-code-and-dynamic-light-effects/8d199ad8365722e3a47d6add36206acb/>PikWizard</a>
</span>
</span>
<span class="image-link">
<span
style="margin: 0 0 20px 0; display: inline-block; vertical-align: middle; width: 100%;"
>
<a
target="_blank"
href="https://pikwizard.com/photo/data-visualization-with-code-and-dynamic-light-effects/8d199ad8365722e3a47d6add36206acb/"
style="text-decoration: none; font-size: 10px; margin: 0;"
>
<img src="https://pikwizard.com/pw/medium/8d199ad8365722e3a47d6add36206acb.jpg" style="margin: 0; width: 100%;" alt="" />
<p style="font-size: 12px; margin: 0;">PikWizard</p>
</a>
</span>
</span>
Free (free of charge)
Free for personal and commercial use.
Author: People Creations