- Home >
- Stock Photos >
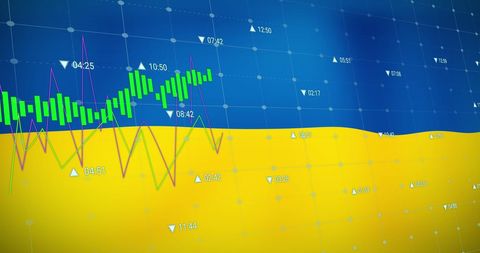
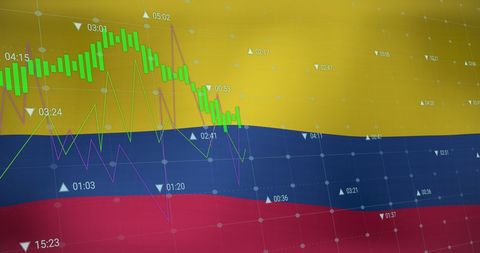
- Data Visualization with Diagrams on Green Gradient
Data Visualization with Diagrams on Green Gradient Image

Diagrams displaying data trends and analysis over a green gradient symbolize modern technology and digital advancement. Useful in presentations, articles, or marketing materials related to business analytics, data science, or technology-driven markets.

downloads
Tags:
More
Credit Photo
If you would like to credit the Photo, here are some ways you can do so
Text Link
photo Link
<span class="text-link">
<span>
<a target="_blank" href=https://pikwizard.com/photo/data-visualization-with-diagrams-on-green-gradient/156ad6cf275ad8952c14d3d7f0efedec/>PikWizard</a>
</span>
</span>
<span class="image-link">
<span
style="margin: 0 0 20px 0; display: inline-block; vertical-align: middle; width: 100%;"
>
<a
target="_blank"
href="https://pikwizard.com/photo/data-visualization-with-diagrams-on-green-gradient/156ad6cf275ad8952c14d3d7f0efedec/"
style="text-decoration: none; font-size: 10px; margin: 0;"
>
<img src="https://pikwizard.com/pw/medium/156ad6cf275ad8952c14d3d7f0efedec.jpg" style="margin: 0; width: 100%;" alt="" />
<p style="font-size: 12px; margin: 0;">PikWizard</p>
</a>
</span>
</span>
Free (free of charge)
Free for personal and commercial use.
Author: People Creations