
- Home >
- Stock Photos >
- Data Visualization with Finance Icons and Chart Streamlines
Data Visualization with Finance Icons and Chart Streamlines Image
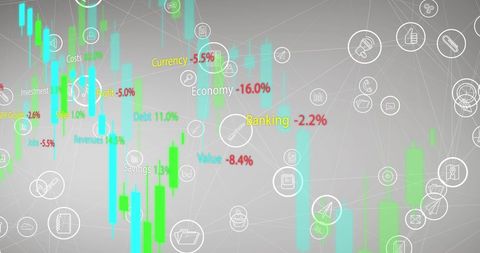
Illustrates complex financial data with interconnected media icons and colorful charts, depicting global business trends. Perfect for presentations on economic analysis, financial technology conferences, and media for financial websites. Visualizes abstraction in global economics for strategic meetings and educational materials.
Powered by 


downloads
Tags:
More
Credit Photo
If you would like to credit the Photo, here are some ways you can do so
Text Link
photo Link
<span class="text-link">
<span>
<a target="_blank" href=https://pikwizard.com/photo/data-visualization-with-finance-icons-and-chart-streamlines/19cd054bc679f83bcc2390fbee5c2017/>PikWizard</a>
</span>
</span>
<span class="image-link">
<span
style="margin: 0 0 20px 0; display: inline-block; vertical-align: middle; width: 100%;"
>
<a
target="_blank"
href="https://pikwizard.com/photo/data-visualization-with-finance-icons-and-chart-streamlines/19cd054bc679f83bcc2390fbee5c2017/"
style="text-decoration: none; font-size: 10px; margin: 0;"
>
<img src="https://pikwizard.com/pw/medium/19cd054bc679f83bcc2390fbee5c2017.jpg" style="margin: 0; width: 100%;" alt="" />
<p style="font-size: 12px; margin: 0;">PikWizard</p>
</a>
</span>
</span>
Free (free of charge)
Free for personal and commercial use.
Author: People Creations
Similar Free Stock Images

Premium


Premium

Premium


Premium


Premium


Premium


Premium


Premium


Premium


Premium


Premium


Premium


Premium


Premium


Premium

Premium


Premium


Premium


Premium


Premium


Premium


Premium


Premium


Premium


Premium

Explore More Free Stock Images