
- Home >
- Stock Photos >
- Data Visualization with Network Engagement Dashboard Interface
Data Visualization with Network Engagement Dashboard Interface Image
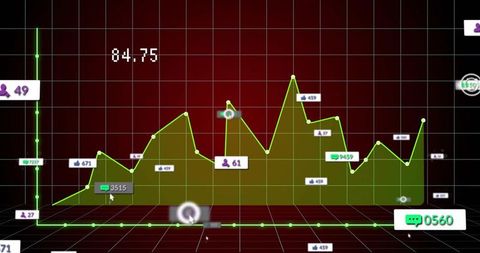
Dynamic green area chart on red-black grid displays analytics and network engagement metrics. Includes interactive icons and 84.75 label highlighting performance data. Ideal for presentations, business reports, and educational materials focusing on data analysis and performance tracking.
Powered by  - Get 15% off with code: PIKWIZARD15


downloads
Tags:
More
Credit Photo
If you would like to credit the Photo, here are some ways you can do so
Text Link
photo Link
<span class="text-link">
<span>
<a target="_blank" href=https://pikwizard.com/photo/data-visualization-with-network-engagement-dashboard-interface/596fe962cc5caf5cf66270b99f74a256/>PikWizard</a>
</span>
</span>
<span class="image-link">
<span
style="margin: 0 0 20px 0; display: inline-block; vertical-align: middle; width: 100%;"
>
<a
target="_blank"
href="https://pikwizard.com/photo/data-visualization-with-network-engagement-dashboard-interface/596fe962cc5caf5cf66270b99f74a256/"
style="text-decoration: none; font-size: 10px; margin: 0;"
>
<img src="https://pikwizard.com/pw/medium/596fe962cc5caf5cf66270b99f74a256.jpg" style="margin: 0; width: 100%;" alt="" />
<p style="font-size: 12px; margin: 0;">PikWizard</p>
</a>
</span>
</span>
Free (free of charge)
Free for personal and commercial use.
Author: Awesome Content
Similar Free Stock Images

Premium


Premium


Premium


Premium


Premium


Premium


Premium


Premium


Premium


Premium


Premium

Premium


Premium


Premium


Premium


Premium


Premium


Premium

Premium


Premium


Premium


Premium


Premium


Premium


Premium

Explore More Free Stock Images