1. Home > 
  2. Stock Photos > 
  3. Data Visualization with Technology Integration and Digital Analytics

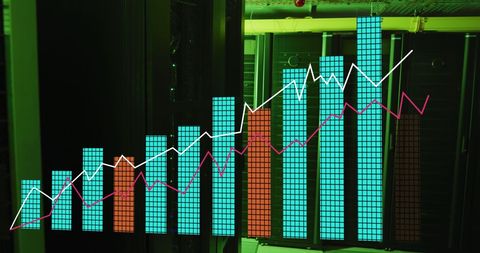
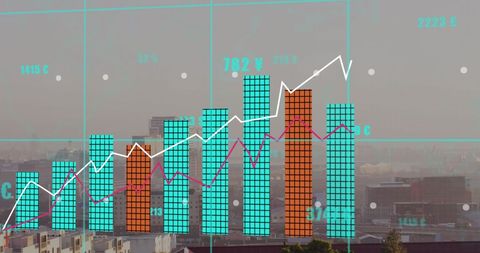
Data Visualization with Technology Integration and Digital Analytics Image

Data Visualization with Technology Integration and Digital Analytics

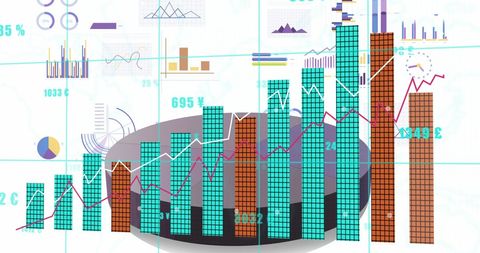
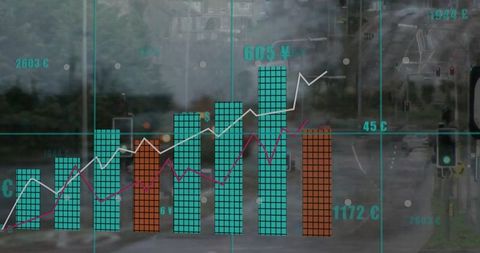
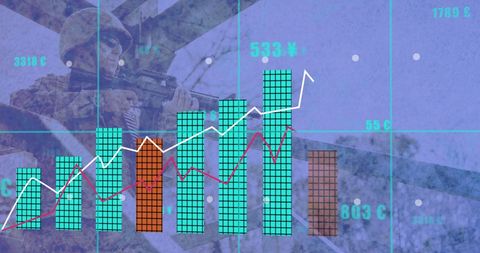
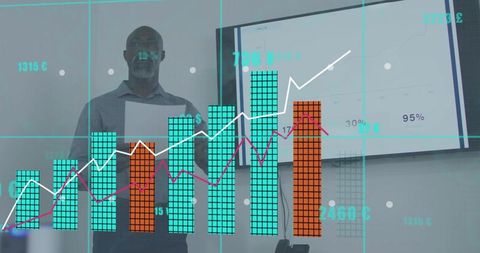
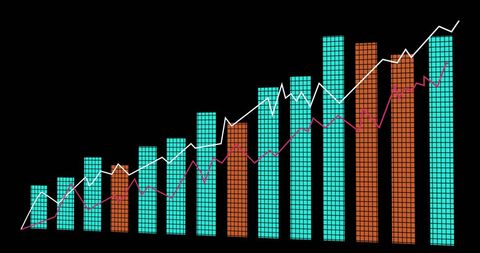
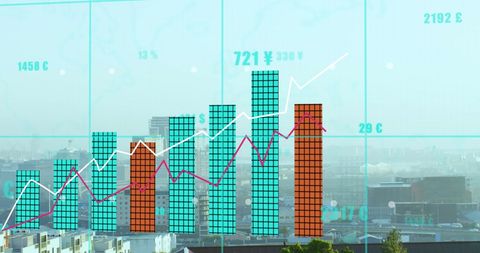
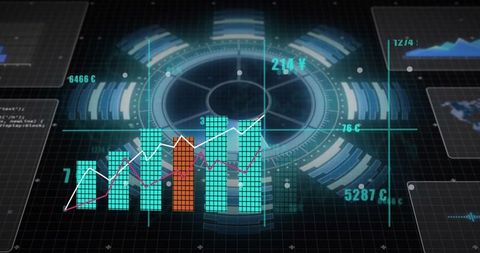
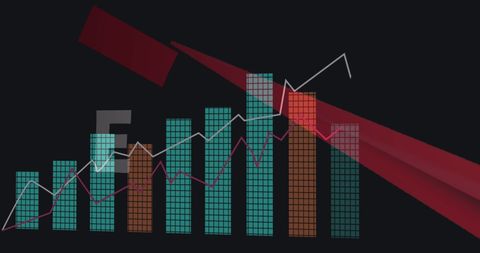
Visual displays featured in business presentations illustrating data trends and futuristic analytics. Effective for technology blogs detailing complex data, industry analysis, economic growth, and development in digital spaces. Suitable for representing concepts in reporting software design or graphics illustrating financial forecasts.

Powered by Shutterstock logo - Get 15% off with code: PIKWIZARD15
KPI data analytics concept, Key performance indicator analysis system. Information technology digital software management. Visualization tech solution. Business artificial intelligence. AI dashboard. - Powered by Shutterstock - Get 15% off with code: PIKWIZARD15Abstract flying dragons on a dark blue background. Technological background for design on the topic of artificial intelligence, neural networks, big data. Copy space - Powered by Shutterstock - Get 15% off with code: PIKWIZARD15Businessman using laptop computer analyzing sales data and financial growth graph chart report. Business planning, strategy and development. Financial accounting. market research, data analysis - Powered by Shutterstock - Get 15% off with code: PIKWIZARD15Abstract wave shape on a low-polygonal triangular background for design on the topic of cyberspace, big data, metaverse, network security, data transfer on dark blue abstract cyberspace background. - Powered by Shutterstock - Get 15% off with code: PIKWIZARD15Big data technology and data science. Data scientist querying, analysing and visualizing complex information on virtual screen. Data flow concept. Business analytics, finance, neural network, AI, ML. - Powered by Shutterstock - Get 15% off with code: PIKWIZARD15

Credit Photo

If you would like to credit the Photo, here are some ways you can do so

Free (free of charge)

Free for personal and commercial use.

Author: Awesome Content

Similar Free Stock Images

Digital Infographic Illustrating COVID-19 Data Statistics Pandemic Impact
Premium
Scientist working with business data, finance, marketing report, Big Data Analytics technology, Processing Complexity information flow on virtual screen, machine learning, artificial intelligence, ML
Abstract Neural Network AI Concept with DNA Helix
Dynamic Financial Data and Progress Chart Display
Digital Financial Graph Analysis with Data Interface
Global Financial Data Visualization Overlaying Earth
Premium
Data science and big data technology. Engineer computing, analysing and visualizing complex data stream on computer. Data mining, artificial intelligence, machine learning, business analytics.
Global Financial Data Processing with Digital Interface Overlay
Colorful Financial Data Overlay on Cityscape Sky
Biometrics Data Processing in Digital Technology Interface
Digital Data Analytics Showing Bar Graph and Curves on Black Background
Premium
Data and AI Powering Global Analytics: Visualize data-driven insights with AI and big data, showcasing global networks, large language models, artificial neural network and digital transformation.
Financial Data Processing Over City Skyline
Digital Graph Analytics with Currency Symbols in Virtual Background
Digital Graphs Overlaying Advanced Data Server Infrastructure
Financial Data Processing with Digital Graphs and Numbers
Premium
Dashboard finance management on laptop computer analyzing sales data and growth graph chart report. Business planning, strategy and development. Financial accounting. market research, data analysis
Financial Graphs and Data Overlapping Office Background
Diverse Team Analyzing Growth Charts in Modern Office Setting
Digital Analytics Graphs on Futuristic Interface Background
Global Financial Data Analysis with Graphs and Currency Chart
Premium
Data science and big data technology. Scientist computing, analysing and visualizing complex data set on computer. Data mining, artificial intelligence, machine learning, business analytics.
Digital Display of Global Financial Data Process
Financial Data Analytics with Interactive Graphs and Charts
Business Growth Graph in Modern Empty Office Background
Digital Interface with Data Processing and Global Maps
Premium
Analyst working with Business Analytics and Data Management System on computer to make report with KPI and metrics connected to database. Corporate strategy for finance, operations, sales, marketing
Global Data Analytics with Futuristic Charts Over Earth
Futuristic Holographic Data Visualization with Digital Metrics
Futuristic Financial Chart on Glass Display Showing Growth Trends
Rising Multi-Series Financial Bar Chart Showing Trend Lines on Glass Dashboard
Colorful 3D Bar Graph with Digital Interface Elements
Digital Data Visualization on Car Interface Display
Premium
Businessman using AI technology on software ready to use robot to create or analyze data and big data technology. Business analysis and visualization of complex data sets on computer on computer
Financial Data Analytics in a High-Tech Digital Environment
Digital Interface Abstract Design with Social Media Icons
Futuristic Digital Economy Growth Chart and Global Map
Business Analytics Graphs Overlaid on Data Center Servers
Premium
Two Digital Computer Screens with Financial Analytical Data in Modern Monitoring Office. Control Room with Finance Specialists Sit in Front of Computers.
Digital Data Visualization with DNA Strand Overlaying Graphs
Diverse Businesspeople Analyzing Financial Data Charts Digital Background
Statistical Financial Data Analysis on Digital Grid
Digital Graphs and Currency Symbols Over Data Servers
Premium
Man look at the dashboard with graphs and charts. Concept of data management system, business intelligence, data statistics, marketing analysis, key performance indicators (KPI) and analytics.
Businessman Analyzing Complex Digital Data Interface
Futuristic Data Visualization Over Urban Cityscape Skyline
Visuals Exploring Business Analytics and Digital Connectivity
Statistical Data and Networks on Computer Servers
Premium
Businesswoman analyzes to chart data business on a visual screen dashboard, technology devices and screens visible in the background, financial planning, market research, and the stock market.
Futuristic Digital Interface with Circuit Patterns and Data Visualization
Soaring Follower Count with Digital Data Growth Indicators
Analyzing Financial Growth with Data Graphs and Market Indicators
Dynamic Financial Growth Chart with Digital Data Streams
Premium
Data science and big data technology.  Big data analytics visualizing on touchscreen. Data mining.
Colorful Bar and Line Charts Analyzing Financial Data Over Dark Background
Innovative Mixed Media Cityscape with Data Graphs
Financial Data Visualization Over Cityscape with Bar Graphs and Charts
Dynamic Financial Dashboard with Bar Charts and Trend Lines
Premium
AI, Big Data, and business analytics icons represent the integration of advanced technology in analyzing graphs, business data, and market trends, driving strategic decisions and innovative solutions.
Dynamic Financial Chart with Bar Graphs and Currency Analysis
Global Stock Market Trends and Currency Analysis Visualization
Neon data viz showing glowing vertical grid bars with white and magenta trend lines
Digital Data Visualization with futuristic elements
Financial Graph with Ukraine Flag Highlighting Economic Crisis
Digital Graphs and Charts on Tech Background Illustrating Data Analysis
Premium
Lines and dots flying away from the center on a blue background to illustrate the information network, artificial intelligence, big data, and neural connections. Copy space
Financial Data Analysis with Ukraine Flag Background
Global Data Analysis with Virus Imagery in Background
Global Financial Data and Digital Trading Interface
Global Financial Growth Trends Visualization with Data Graphs
Premium
Digital economic growth chart with a rising trend towards 2025, symbolizing future market predictions.
Futuristic Cityscape with Data and Technology Interface
Financial Data Processing Over Cityscape Digital Interface
Innovative Digital Data Chart Overlaid on Glass Building
Descending Arrow Icons with Colored Bar Graphs on Black Background
Premium
Businessman using analytics data KPI technology and data management system. Corporate strategy for finance, operations, sales, marketing.
Futuristic Digital Interface with Data Circuit Visualization
Futuristic Business Technology Interface with Graphs and Icons
Digital Overlay of Market Charts with Soldier Silhouette
Futuristic Data and Financial Analysis in Modern Office Environment
Premium
Big data analysed with AI technology for business analytics. Getting insights from data mining, filtering, sorting, clustering. Data scientist working on visualization on virtual computer screen.
Dynamic Financial Data Analytics in Digital Office Environment
Futuristic Financial Data Visualization Chart and Global Analytics
Dynamic Financial Data Display with Global Indicators
Futuristic Data Analytics Visualization with Graph and DNA Strand
Premium
A hand interacts with holographic data visuals above a laptop, showcasing modern technology and data analysis.
Abstract Financial Data Analysis with Bar and Line Graphs
Digital Interface with Global Financial Data and Bar Graphs
Futuristic Data Analytics Dashboard in Tech Interface
Futuristic Data Visualization with Graph Overlay in Green-Lit Server Room
Premium
AI, Big Data, and business analytics icons represent the integration of advanced technology in analyzing graphs, business data, and market trends, driving strategic decisions and innovative solutions.
Digital Financial Dashboard with Bar Chart and Trend Lines
Futuristic 3D data visualization displaying teal orange bar charts and trend lines in hologram
Digital Interface with Financial Data Projections
Digital Bar and Line Chart with Financial Data Overlay
Dynamic Data Processing with Digital Interface Elements
Abstract Financial Graphs with Digital Interface Elements
Premium
Analyst working with Business, Concept digital transformation technology strategy, Analytics and Data Management System on computer, make a report with KPI and metrics connected to database.
Dynamic Digital Financial Graphs and Global Data Processing
Financial Data Processing Across Global Digital Network
Digital Data Hologram with Circuit Board and Globe Elements
Growth Charts and Data Analysis Visual Illustration
Premium
Big data technology and data science. Data scientist querying, analysing and visualizing complex set on virtual screen. Data flow concept. Neural network, artificial intelligence, ML, analytics.
Financial Data Graph with Urban Skyline Background
Financial Data Visualization with Futuristic Bars and Lines
Global Data Analytics Overlay with Earth Background
Rising Global Economy with Statistics and Financial Analysis
Premium
Business development and technology Data analyst. business analytics dashboard Business Intelligence (BI) data visualization, metrics and KPI key performance indicators and reports management.
Digital Data Analysis Over City Skyline
Digital Data Processing with Animated Bar Graphs on Global Scale
Financial Growth Trends Overlaid on Equatorial Guinea Flag
Digital Financial Dashboard with Analytics and Data Visualization
Premium
Professional data analyst using data visualizations dashboard on computer monitor for data business analysis and Data Management System
Colorful Digital Bar Graph Data Analysis Concept
Caucasian Businessman Analyzing Financial Data Charts on Laptop
Rising Bar and Line Graph on Blue Background Shows Financial Growth
Digital Graph Illustrating Financial Data Analysis Trends
Premium
Person using computer mouse for HR and people analytics, transforming the HR landscape for sustainable business success. Deeply data-driven people processes. Data Management System
Dynamic Financial Market Data and Graphs on Digital Display
Data Analytics Concept with Financial Growth Chart in Digital Interface
Interactive Financial Dashboard with Bar and Line Graphs
Digital Financial Analysis Dashboard with Bar and Line Graphs
Premium
businessman working with business Analytics and Data Management System on computer, online document management and metrics connected to database. Corporate strategy for finance, operations, sales.
Analysts analyzing financial dashboard with turquoise orange bar charts and line trends