
- Home >
- Stock Photos >
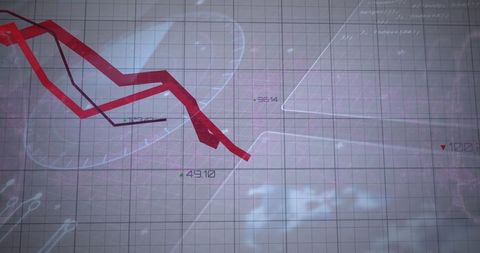
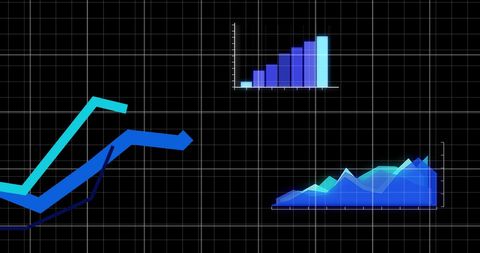
- Data Visualization with Trend Lines and Virus Silhouettes Overlay
Data Visualization with Trend Lines and Virus Silhouettes Overlay Image

Featuring an abstract digital dashboard, this design uses crossing blue trend lines and virus-like silhouettes on a teal grid background. Representing data analytics, this visualization can be used in technology presentations, reports on healthcare innovations, or education materials focusing on data science and digital analysis. It effectively conveys complex information in a visual format, highlighting trends and projections related to medical or technological advancements.
Powered by 


downloads
Tags:
More
Credit Photo
If you would like to credit the Photo, here are some ways you can do so
Text Link
photo Link
<span class="text-link">
<span>
<a target="_blank" href=https://pikwizard.com/photo/data-visualization-with-trend-lines-and-virus-silhouettes-overlay/c4baf8dc27d2e9df8034d6ef923d3dd5/>PikWizard</a>
</span>
</span>
<span class="image-link">
<span
style="margin: 0 0 20px 0; display: inline-block; vertical-align: middle; width: 100%;"
>
<a
target="_blank"
href="https://pikwizard.com/photo/data-visualization-with-trend-lines-and-virus-silhouettes-overlay/c4baf8dc27d2e9df8034d6ef923d3dd5/"
style="text-decoration: none; font-size: 10px; margin: 0;"
>
<img src="https://pikwizard.com/pw/medium/c4baf8dc27d2e9df8034d6ef923d3dd5.jpg" style="margin: 0; width: 100%;" alt="" />
<p style="font-size: 12px; margin: 0;">PikWizard</p>
</a>
</span>
</span>
Free (free of charge)
Free for personal and commercial use.
Author: Awesome Content
Similar Free Stock Images

Premium


Premium

Premium


Premium


Premium


Premium


Premium


Premium


Premium


Premium


Premium


Premium


Premium


Premium


Premium

Premium


Premium


Premium


Premium


Premium


Premium


Premium


Premium


Premium


Premium

Explore More Free Stock Images