
- Home >
- Stock Photos >
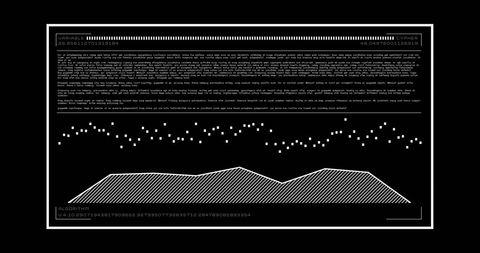
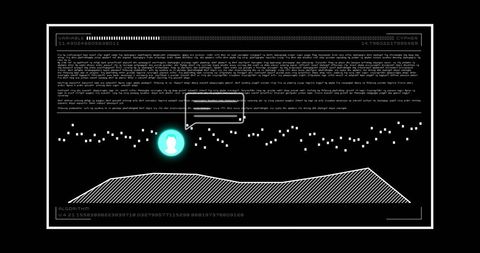
- Data Visualization with Waveform and Histogram Overlays
Data Visualization with Waveform and Histogram Overlays Image

This digital composition featuring waveform and histogram makes powerful visual representation for data analysis. Mathematic symbols like 'multicurvelog', futuristic design elements suggest use in finance, science projects, tech jobs presenting vast information. Great use includes audience targeting seminars, digital presentations, educational material, or modern slide design, demonstrating complex data visualization ideas clearly. Background is ideal for enhancing creativity in posters incorporating analytical design trends.
Powered by  - Get 15% off with code: PIKWIZARD15


downloads
Tags:
More
Credit Photo
If you would like to credit the Photo, here are some ways you can do so
Text Link
photo Link
<span class="text-link">
<span>
<a target="_blank" href=https://pikwizard.com/photo/data-visualization-with-waveform-and-histogram-overlays/3f666f41f1aafe2ccd5e87e32f0aed9f/>PikWizard</a>
</span>
</span>
<span class="image-link">
<span
style="margin: 0 0 20px 0; display: inline-block; vertical-align: middle; width: 100%;"
>
<a
target="_blank"
href="https://pikwizard.com/photo/data-visualization-with-waveform-and-histogram-overlays/3f666f41f1aafe2ccd5e87e32f0aed9f/"
style="text-decoration: none; font-size: 10px; margin: 0;"
>
<img src="https://pikwizard.com/pw/medium/3f666f41f1aafe2ccd5e87e32f0aed9f.jpg" style="margin: 0; width: 100%;" alt="" />
<p style="font-size: 12px; margin: 0;">PikWizard</p>
</a>
</span>
</span>
Free (free of charge)
Free for personal and commercial use.
Author: Authentic Images
Similar Free Stock Images
Premium


Premium

Premium


Premium


Premium


Premium


Premium


Premium


Premium

Premium


Premium


Premium


Premium


Premium


Premium


Premium


Premium


Premium


Premium


Premium


Premium

Premium


Premium


Premium


Premium


Explore More Free Stock Images