
- Home >
- Stock Photos >
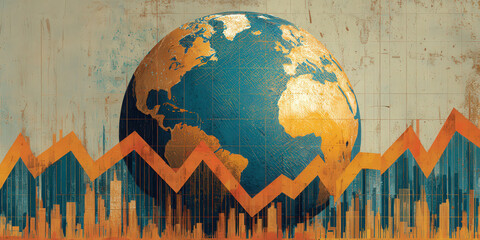
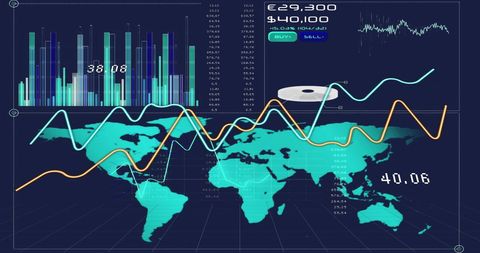
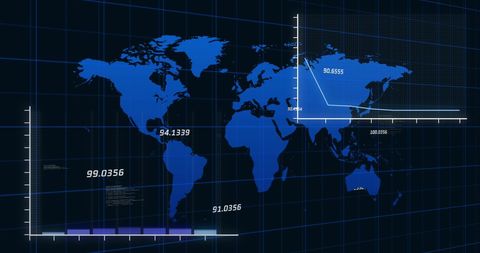
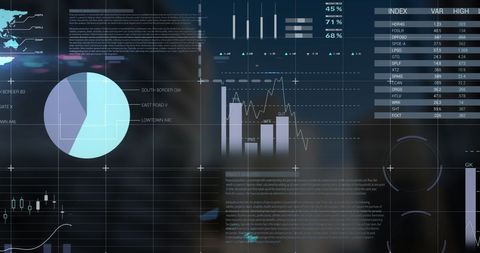
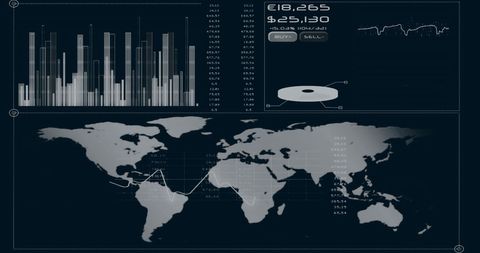
- Data Visualization with World Map and Financial Graphs
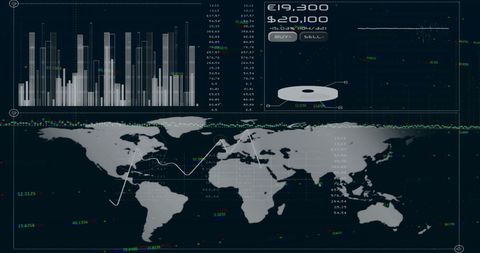
Data Visualization with World Map and Financial Graphs Image
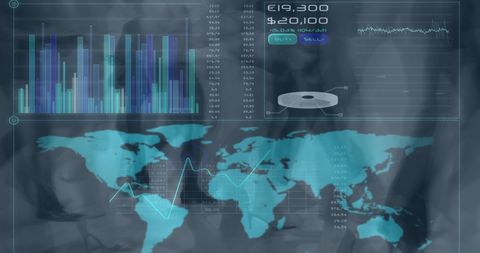
Digital illustration features financial graphs and a detailed world map depicting a synergy of global business and technology concepts. Useful for presentations in finance, economics, and global market analysis. Ideal for illustrating data-driven workshops, and seminars, emphasizing international business communication and technological advancements in global trade.
Powered by 


downloads
Tags:
More
Credit Photo
If you would like to credit the Photo, here are some ways you can do so
Text Link
photo Link
<span class="text-link">
<span>
<a target="_blank" href=https://pikwizard.com/photo/data-visualization-with-world-map-and-financial-graphs/7d7deb3fe7e4d604b68da42075d9e393/>PikWizard</a>
</span>
</span>
<span class="image-link">
<span
style="margin: 0 0 20px 0; display: inline-block; vertical-align: middle; width: 100%;"
>
<a
target="_blank"
href="https://pikwizard.com/photo/data-visualization-with-world-map-and-financial-graphs/7d7deb3fe7e4d604b68da42075d9e393/"
style="text-decoration: none; font-size: 10px; margin: 0;"
>
<img src="https://pikwizard.com/pw/medium/7d7deb3fe7e4d604b68da42075d9e393.jpg" style="margin: 0; width: 100%;" alt="" />
<p style="font-size: 12px; margin: 0;">PikWizard</p>
</a>
</span>
</span>
Free (free of charge)
Free for personal and commercial use.
Author: Authentic Images
Similar Free Stock Images
Premium


Premium


Premium


Premium


Premium


Premium


Premium


Premium

Premium


Premium


Premium


Premium


Premium


Premium


Premium


Premium


Premium


Premium

Premium

Premium


Premium


Premium


Premium

Premium


Premium


Explore More Free Stock Images