
- Home >
- Stock Photos >
- Data Visualizations: Global Finance and Economy Metrics
Data Visualizations: Global Finance and Economy Metrics Image
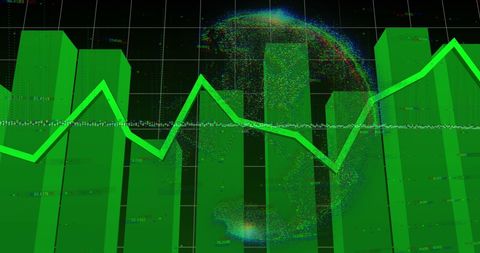
Number yields zigzag and dashed lines emerge alongside rich green transaction history bar numbers depict strong market shifts in finance scenes. Perfect for representing global economics, financial reports, stock trade analysis, and advanced data technology targets blend peek objective sectors appropriately.
Powered by  - Get 15% off with code: PIKWIZARD15


4
downloads
downloads
Tags:
More
Credit Photo
If you would like to credit the Photo, here are some ways you can do so
Text Link
photo Link
<span class="text-link">
<span>
<a target="_blank" href=https://pikwizard.com/photo/data-visualizations-global-finance-and-economy-metrics/25b9a1c3762021e9fd7cf9bcb66ccdc6/>PikWizard</a>
</span>
</span>
<span class="image-link">
<span
style="margin: 0 0 20px 0; display: inline-block; vertical-align: middle; width: 100%;"
>
<a
target="_blank"
href="https://pikwizard.com/photo/data-visualizations-global-finance-and-economy-metrics/25b9a1c3762021e9fd7cf9bcb66ccdc6/"
style="text-decoration: none; font-size: 10px; margin: 0;"
>
<img src="https://pikwizard.com/pw/medium/25b9a1c3762021e9fd7cf9bcb66ccdc6.jpg" style="margin: 0; width: 100%;" alt="" />
<p style="font-size: 12px; margin: 0;">PikWizard</p>
</a>
</span>
</span>
Free (free of charge)
Free for personal and commercial use.
Author: Authentic Images
Similar Free Stock Images

Premium


Premium


Premium


Premium


Premium


Premium


Premium


Premium


Premium


Premium


Premium


Premium


Premium


Premium


Premium


Premium


Premium


Premium


Premium


Premium


Premium


Premium


Premium


Premium

