- Home >
- Stock Photos >
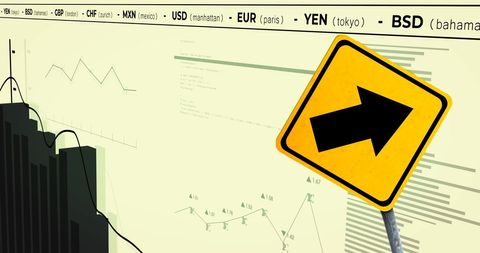
- Decision Sign with Stock Market Graph on Black Background
Decision Sign with Stock Market Graph on Black Background Image

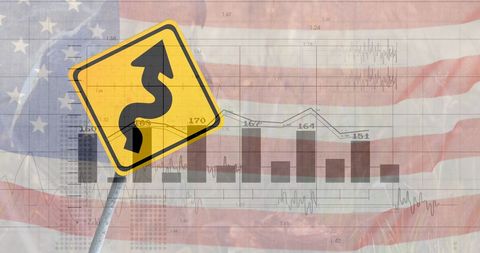
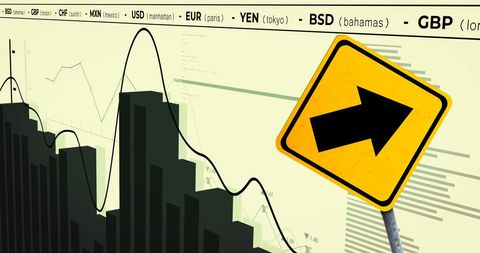
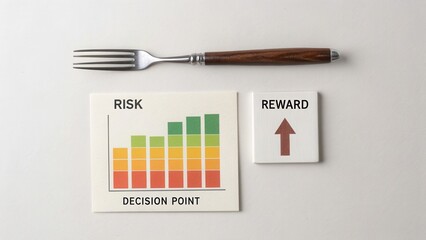
Image shows yellow crossroads sign in front of financial data and graph, depicting decision-making in business and finance. Ideal for presentations on economics, financial forecasting, investment strategies, and market trends. Useful for illustrating complex decision processes in corporate and financial industry settings.
Powered by 


downloads
Tags:
More
Credit Photo
If you would like to credit the Photo, here are some ways you can do so
Text Link
photo Link
<span class="text-link">
<span>
<a target="_blank" href=https://pikwizard.com/photo/decision-sign-with-stock-market-graph-on-black-background/1c95bd502f944528a52c09ad74e8207d/>PikWizard</a>
</span>
</span>
<span class="image-link">
<span
style="margin: 0 0 20px 0; display: inline-block; vertical-align: middle; width: 100%;"
>
<a
target="_blank"
href="https://pikwizard.com/photo/decision-sign-with-stock-market-graph-on-black-background/1c95bd502f944528a52c09ad74e8207d/"
style="text-decoration: none; font-size: 10px; margin: 0;"
>
<img src="https://pikwizard.com/pw/medium/1c95bd502f944528a52c09ad74e8207d.jpg" style="margin: 0; width: 100%;" alt="" />
<p style="font-size: 12px; margin: 0;">PikWizard</p>
</a>
</span>
</span>
Free (free of charge)
Free for personal and commercial use.
Author: Creative Art
Similar Free Stock Images
Loading...


Premium


Premium

Premium


Premium


Premium

Premium


Premium


Premium


Premium


Premium


Premium


Premium


Premium

Premium


Premium

Premium


Premium


Premium


Premium


Premium


Premium


Premium


Premium


Premium


Premium