1. Home > 
  2. Stock Photos > 
  3. Declining Bar Graph Overlaid on Waterfront Abstract

Declining Bar Graph Overlaid on Waterfront Abstract Image

Declining Bar Graph Overlaid on Waterfront Abstract

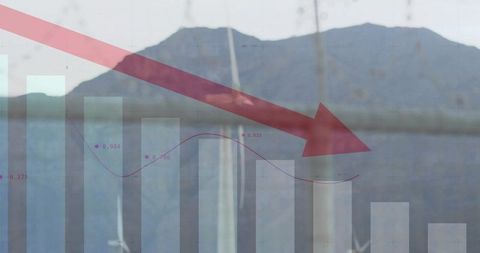
Overlay of declining bar graph with red arrow against out-of-focus waterfront with sailboat masts. Purple line traces plot points, conveying data variance. Creative use in finance, business analytics context. Suitable for presentations, reports, abstracts on financial downturn, gesturing retro-modern design in analytics visuals.

Powered by Shutterstock logo - Get 15% off with code: PIKWIZARD15
Stock crash market exchange loss trading graph analysis investment indicator business graph charts of financial digital background arrow down stock crisis red price in down trend chart fall - Powered by Shutterstock - Get 15% off with code: PIKWIZARD15Stock market crash, declined economic, graph falling down and digital indicators overlaps modernistic city. Double exposure. - Powered by Shutterstock - Get 15% off with code: PIKWIZARD15Right-up arrow cutted from solid sheet of yellow paper and curved up of one side with white paper underlay showing growth of stock market or up direction - Powered by Shutterstock - Get 15% off with code: PIKWIZARD15Businessman trading stocks market financial depressed / Crisis stock market graph chart down trend red price drop arrow down chart fall investment loss crash business crisis economy - Powered by Shutterstock - Get 15% off with code: PIKWIZARD15Depressed Businessman Leaning His Head Below a Bad Stock Market Chart - Powered by Shutterstock - Get 15% off with code: PIKWIZARD15

Credit Photo

If you would like to credit the Photo, here are some ways you can do so

Free (free of charge)

Free for personal and commercial use.

Author: Authentic Images

Similar Free Stock Images

Falling Graph and Red Arrow Indicates Declining Trends
Premium
All world stock fail background and digital red number on stock board. Concept of financial crisis. Stock market down trend and despair broker man on graph and number with bearis time.
Business Financial Decline Representation with Arrow Overlapping Graphs
Financial Growth Trends Overlaid on Urban Skyscraper Cityscape
Rising Financial Chart with Arrow on Urban Train Platform
Business Charts Showing Declining Financial Trends
Premium
Stock market exchange loss trading graph analysis investment indicator business graph charts of financial board. Depressed businessman holding hands on bowed head, looking at declining graph.
Stock Market Graph Overlay with Urban Building Background
Stock Market Data Overlay with Cityscape and Traffic
Global Business Arrow Showing Economic Decline with Data Analytics
Futuristic Data Visualization Over Wind Turbines
Premium
arrows indicating the path of development and regression. Progression and regression symbol. Conceptual, motivational words. Green arrow is moving forward, red arrow is moving backward
Digital Globe with Data Overlays on Blurred Cityscape Background
Declining Global Market Trends Over Urban Skyline
Upward Trend Arrow with Blue Digital Graph Over Landscape
Data Management Illustrating Growth Over Digital Landscape
Premium
Magnifying glass focusing on red down arrow with dollar symbol, representing cost analysis, financial loss, market downturn, or decline in digital ad performance and browser-based sales tracking.
Digital Finances Overlaying Cityscape for Financial Analysis Concept
Financial Market Decline with Red Arrow and Bar Graph
Sustainable Energy and Global Economy Concept Composite
Sustainability and Energy Data Overlay on Renewable Field
Premium
Diagram showing market price crashing on computer screen with arrow pointing down. Stock price dropping collage concept isolated on red background
Renewable Energy and Data Analytics in Futuristic Business Concept
Abstract Market Decline with Graph and Grass in Background
Descent in Agriculture Investment on Rural Landscape
Digital Analysis in Renewable Energy with Wind Turbines and Data Overlay
Premium
Stock crash market exchange loss trading graph analysis investment indicator business graph charts of financial digital background arrow down stock crisis red price in down trend chart fall
Futuristic Urban Landscape with Digital Data Overlay
Declining Business Trends With Red Arrow Over Bar and Line Graphs
Agriculture Success Visualized with Red Arrow and Barbed Fence
Sustainable Energy and Stock Market Trends Converging Over Farmland
Digital Financial Graphs with Urban Building Background
Global Market Decline Over Urban Cityscape Background
Premium
Stock market crash with arrow going down and red graph decreasing. Capital at risk. Bitcoin on arrow goes down and line charts with extreme price drop cryptocurrencies market Spot, futures and funding
Glitch Effect on Declining Finance Graph with Red Arrow
3D Graphs Show Financial Markets Predictions Negative Trend
Global Finance Growth with Dynamic Arrow and Data Chart
Multiple Exposure of Financial Graphs and Wind Turbines in Field
Premium
The Inflation and recession of the economy of global.The concept of economic collapse and the collapse of the stock exchange on stacks of coins and a graph arrow pointing down.
Financial Market Data Overlaying Cityscape Illustrates Economic Trends
Global Business Decline and Economic Downturn Concept
Digital Financial Data Analysis by Urban Cityscape Overlay
Financial Success Indicator with Traffic Flow Overlay
Premium
All world stock fail background and digital red number on stock board. Concept of financial crisis. Stock market down trend and despair broker man on graph and number with bearis time.
Digital Data Processing Overlay on European Map
Rising Business Growth and Analytics Visualization
Red Downward Arrow with Bar Chart Over Cloudy Sky Background
Global Financial Data Analytics with Urban Skyline Background
Premium
A miniature shopping cart with downward-pointing red arrow. Retail trends, decrease in sales, sales drop concept.
Cityscape with Data Overlay Highlighting Financial Market Trends
Statistical Data and Renewable Energy Technology Concept
Data Overlay on Wind Farm for Renewable Energy Analytics
Declining Market Trend with Downward Sloping Arrow
Premium
Stock market and cryptocurrency market in free fall. A red arrow points to the bottom, where Bitcoin and other digital currencies are heading. This is the worst economic crisis in history.
Business Metrics with Declining Trend Indicated by Red Arrow
Digital Dashboard Overlaid on Scenic Landscape with Charts
Financial Growth Visualization Against Mountain Landscape
Digital Data Overlay on Wind Turbines in Mountainous Terrain
Premium
A red arrow pointing downwards on top of a pile of US dollar bills. Economic recession, financial decline, economic downturn concept.
Upward Financial Trend Insight Over Scenic Coastal Shoreline
Visualizing Environmental Analytics with Declining Trend and Scenic Landscape
Golfing Performance and Financial Data Synthesis
Declining Financial Trends Affecting Construction Industry
Financial Data Overlay on Sustainable Green Energy Landscape
Renewable Energy and Data Analytics Technology Futuristic Visual
Premium
The stock market is crashing as the red arrow plunges down. Bitcoin and other cryptocurrencies are also losing value rapidly. A red arrow shows the dramatic fall of the stock market.
Concept of Business Growth and Digital Success with Data Processing
Rising Bar Graph with Cityscape Background Symbolizing Business Growth
Futuristic Financial Data Analysis over Skyline
Red Data Line Overlay on Cityscape Represents Financial Trends
Premium
Stock market exchange loss trading graph analysis investment indicator business graph charts of financial board display candlestick double exposure crisis stock crash red price chart fall money
Renewable Energy Financial Analysis with Global Business Concepts
Digital Red Arrow a symbol of Financial Decline in Economy
Digital Financial Data with Rising Chart Visualization
Bar Graph with Downward Red Arrow Indicating Economic Decline
Premium
Stock market crash, declined economic, graph falling down and digital indicators overlaps modernistic city. Double exposure.
Upward Arrow with Graphs Symbolizing Business Growth
Using Transparent Digital Data Interface Over City Highway
Financial Growth Chart Overlaid on Cityscape
Abstract Concept of Financial Data Processing with Equations
Premium
Wooden blocks spelling out ROI with a green upward arrow and a red downward arrow. Perfect for presentations, reports, or any project related to business, finance, marketing, and investment
Wind Turbines with Data Overlay and Mountain Backdrop
Wind Turbines with Digital Metrics for Sustainable Technology Concept
Power Lines and Financial Data with Downward Red Arrow at Dusk
Declining Financial Chart Integrated with Scenic Mountain View
Premium
Wooden blocks with business icons and red arrow pointing down economic crisis, market decline, and financial loss concept.
Finance and Agriculture Data Integrated for Modern Analytics
Renewable Energy Analysis with Wind Turbine and Graph Interface
Red Downward Arrow Overlaid on Urban Financial Charts and Skyscrapers
Financial Chart Overlay on Tranquil Lake Landscape
Premium
Stock exchange loss during financial crisis. Red color down chart move trend.  Stock market graph and bar chart price display computer monitor. Abstract financial background MORE SIMILAR IN MY GALLERY
Business Analyst Engages with Financial Graphs Representing Decline
Bar Chart with Growth Arrow on Scenic Coastal Background
Financial Data Overlay on Garbage Dump Symbolizes Economic Impact
Red Arrow with Graph Overlay on Cityscape Indicating Financial Growth
Data Visualizations Overlay Busy Urban Traffic Scene
Finance and Energy Data Visualization with Electric Power Lines at Sunset
Premium
US dollar price going down with red graph and arrows pointing downward, financial background. High inflation with devaluing currency concept backdrop
Digital Finance Interface with Wind Turbine for Sustainable Energy Planning
Digital Data Visualization over Idyllic Landscape Background
Digital Financial Analysis Over Modern Cityscape
Global Financial Data Visualization Against Urban Backdrop
Premium
Business financial crisis, stock market down, bankruptcy concept. Economic downturn with 3d red falling arrow on lost investment graph, pointing by businessman finger on laptop computer on table.
Arrows Pointing Upward Over Industrial Cityscape
Analytical Graphs and Digital Global Finance Concept
Global Financial Data Processing Over Cityscape Elements
Rising Business Graph Overlay on Blue Sky Background
Premium
Stock market and cryptocurrency market in free fall. A red arrow points to the bottom, where Bitcoin and other digital currencies are heading. This is the worst economic crisis in history.
Abstract Financial Chart with Declining Red Arrow Over Cityscape
Financial Data Overlaying Electricity Pole for Energy Finance Concept
Financial Data and Mathematical Graphs Overlay on City Skyline
Virtual Reality Reinventing Business Despite Market Fluctuations
Premium
The economy contracts and declines in business and investment. The recession causes losses and the stock market falls. Profits are lost. People are unemployed. Employment is reduced.
Red Down Arrow with Bar Chart on Pink Abstract Background
Financial Data Trend and Cityscape Nighttime Panorama
Downward Trend Overlaying Landscape and Power Infrastructure
Downward Arrow on Financial Dashboard Displaying Market Trend
Premium
Salary reduction, recession, financial crisis. Red wooden cube with downward arrow and banknotes.
Declining Market Analysis with Arrow and Bar Chart
Sustainable Business Technology Progress in Wind Energy
Chart Illustrating Downward Financial Trend with Red Arrow
Wind Turbine and Declining Energy Trends with Graphics
Premium
Businessmen typing on a laptop with a cost reduction bar chart, red down arrows, concept of budget planning, financial analysis, and expense optimization.
Red Downward Arrow Crossing Urban Skyline with Teal Bar Graph and Magenta Trend Line Overlay