- Home >
- Stock Photos >
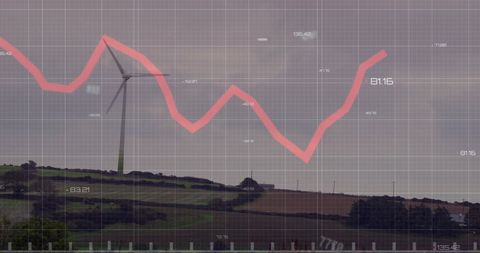
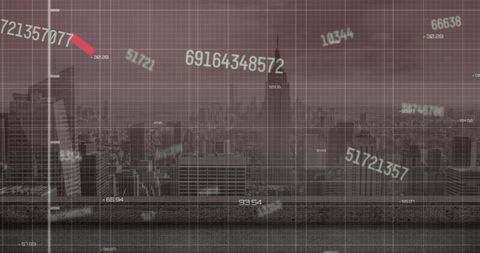
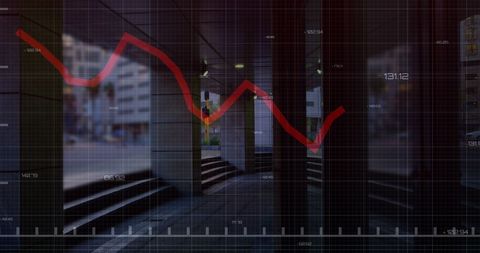
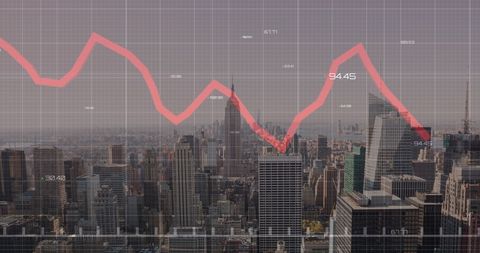
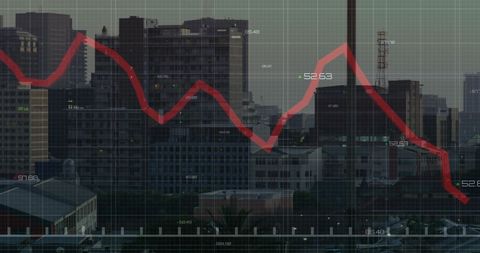
- Declining Financial Chart Displayed Over Urban Cityscape
Declining Financial Chart Displayed Over Urban Cityscape Image

Red downward trend on chart superimposed over cityscape symbolizes economic decline or market loss. Suitable for illustrating economic analysis, market trends, and research insights in presentations and articles on financial topics. Effective for conveying themes of caution, risk, and business forecasting.
Powered by  - Get 15% off with code: PIKWIZARD15


2
downloads
downloads
Tags:
More
Credit Photo
If you would like to credit the Photo, here are some ways you can do so
Text Link
photo Link
<span class="text-link">
<span>
<a target="_blank" href=https://pikwizard.com/photo/declining-financial-chart-displayed-over-urban-cityscape/734111df205caa7eb7b10df6eeeb4286/>PikWizard</a>
</span>
</span>
<span class="image-link">
<span
style="margin: 0 0 20px 0; display: inline-block; vertical-align: middle; width: 100%;"
>
<a
target="_blank"
href="https://pikwizard.com/photo/declining-financial-chart-displayed-over-urban-cityscape/734111df205caa7eb7b10df6eeeb4286/"
style="text-decoration: none; font-size: 10px; margin: 0;"
>
<img src="https://pikwizard.com/pw/medium/734111df205caa7eb7b10df6eeeb4286.jpg" style="margin: 0; width: 100%;" alt="" />
<p style="font-size: 12px; margin: 0;">PikWizard</p>
</a>
</span>
</span>
Free (free of charge)
Free for personal and commercial use.
Author: Awesome Content
Similar Free Stock Images

Premium


Premium


Premium


Premium


Premium


Premium


Premium


Premium


Premium


Premium


Premium


Premium


Premium


Premium


Premium


Premium


Premium


Premium


Premium


Premium


Premium


Premium


Premium


Premium


Premium