
- Home >
- Stock Photos >
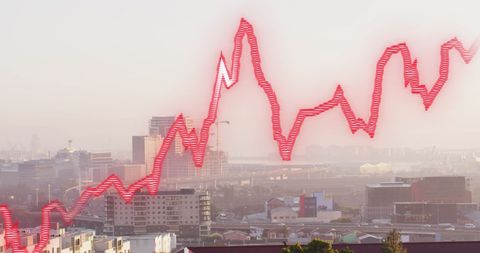
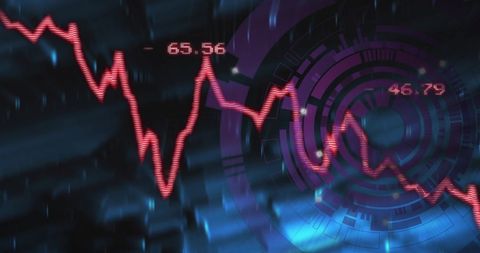
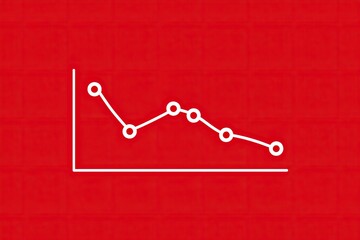
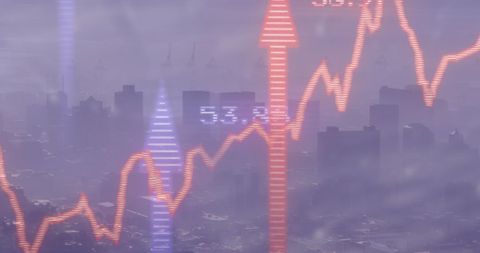
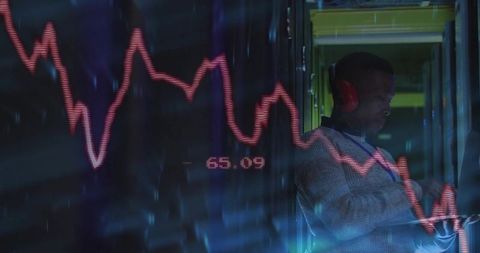
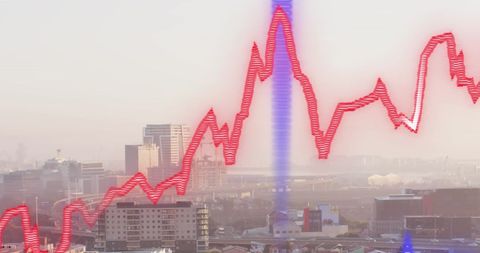
- Declining Financial Chart in Digital Environment
Declining Financial Chart in Digital Environment Image
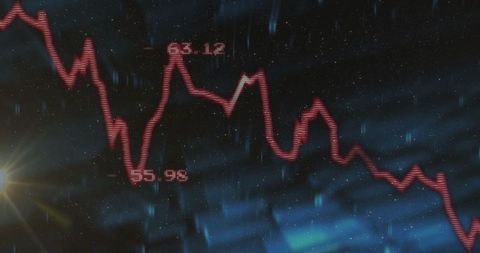
This visualization depicts a red jagged line chart suggesting a decline in financial metrics, suitable for themes relating to economic downturns, market volatility, or trading analysis. With its digital and modern aesthetic, it can underscore presentations on financial hardships, market transactions, or technological advancements in finance apps. Ideal for use in business reports, investment publications, or finance-related content.
Powered by 


downloads
Tags:
More
Credit Photo
If you would like to credit the Photo, here are some ways you can do so
Text Link
photo Link
<span class="text-link">
<span>
<a target="_blank" href=https://pikwizard.com/photo/declining-financial-chart-in-digital-environment/913ffce5acfccd1f9a39da382fddd9a3/>PikWizard</a>
</span>
</span>
<span class="image-link">
<span
style="margin: 0 0 20px 0; display: inline-block; vertical-align: middle; width: 100%;"
>
<a
target="_blank"
href="https://pikwizard.com/photo/declining-financial-chart-in-digital-environment/913ffce5acfccd1f9a39da382fddd9a3/"
style="text-decoration: none; font-size: 10px; margin: 0;"
>
<img src="https://pikwizard.com/pw/medium/913ffce5acfccd1f9a39da382fddd9a3.jpg" style="margin: 0; width: 100%;" alt="" />
<p style="font-size: 12px; margin: 0;">PikWizard</p>
</a>
</span>
</span>
Free (free of charge)
Free for personal and commercial use.
Author: Awesome Content
Similar Free Stock Images

Premium


Premium


Premium


Premium


Premium


Premium

Premium
Premium

Premium


Premium


Premium

AI


Premium


Premium


Premium

Premium
Premium


Premium


Premium


Premium


Premium


Premium

AI


Premium


Premium


Premium


Premium

Explore More Free Stock Images