- Home >
- Stock Photos >
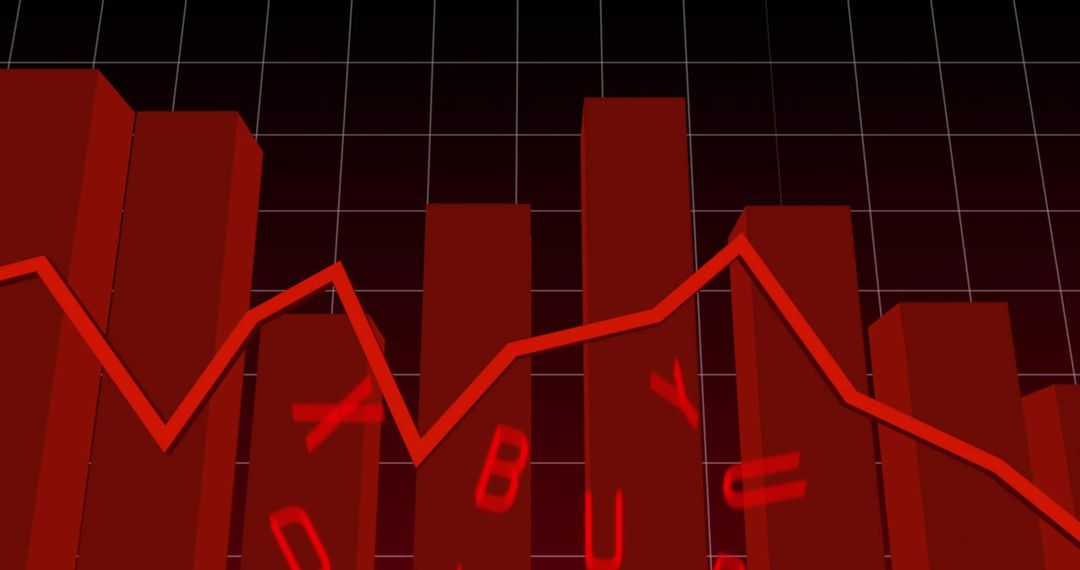
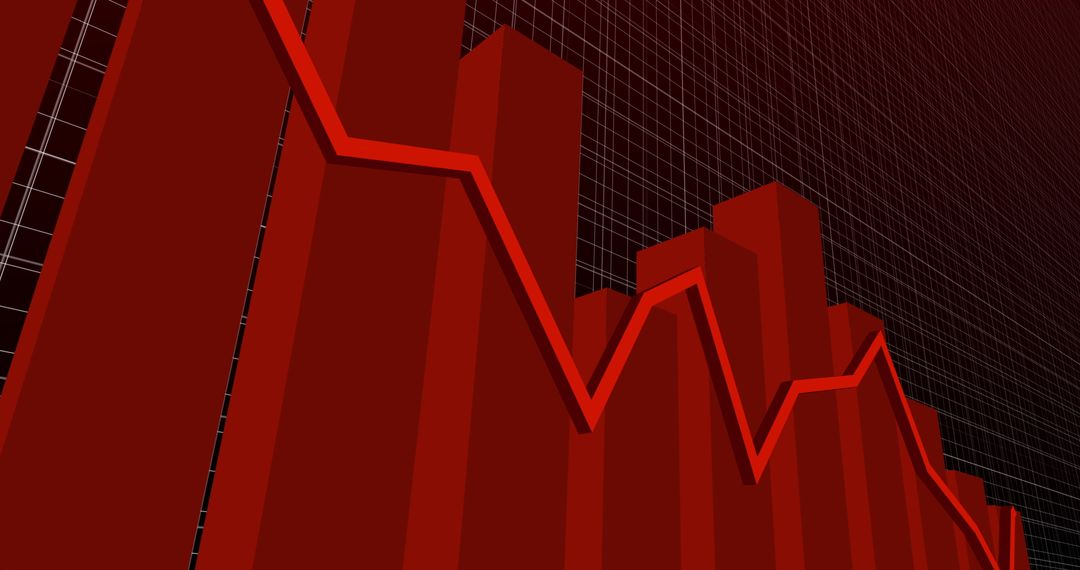
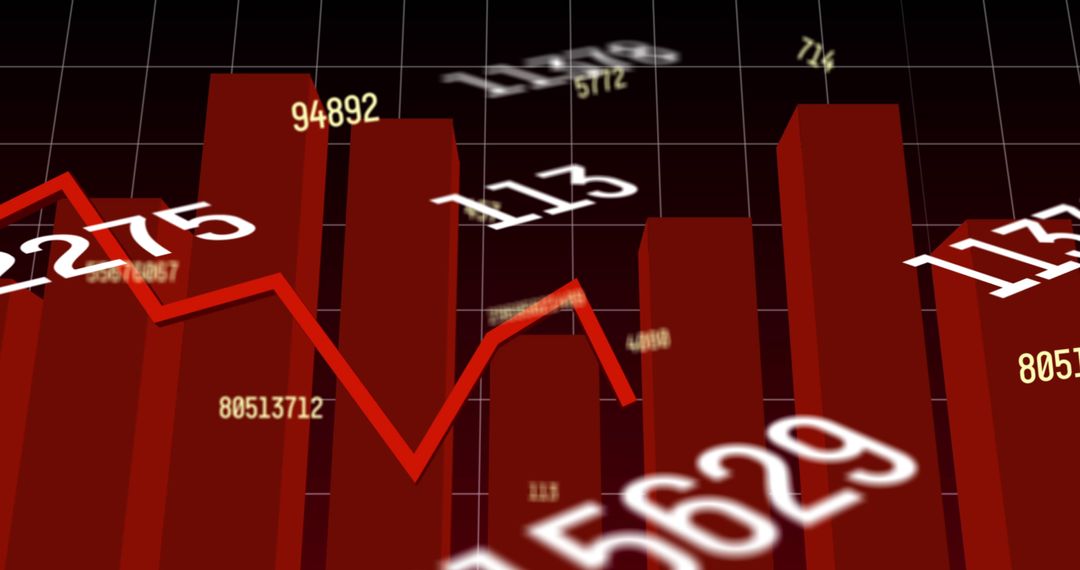
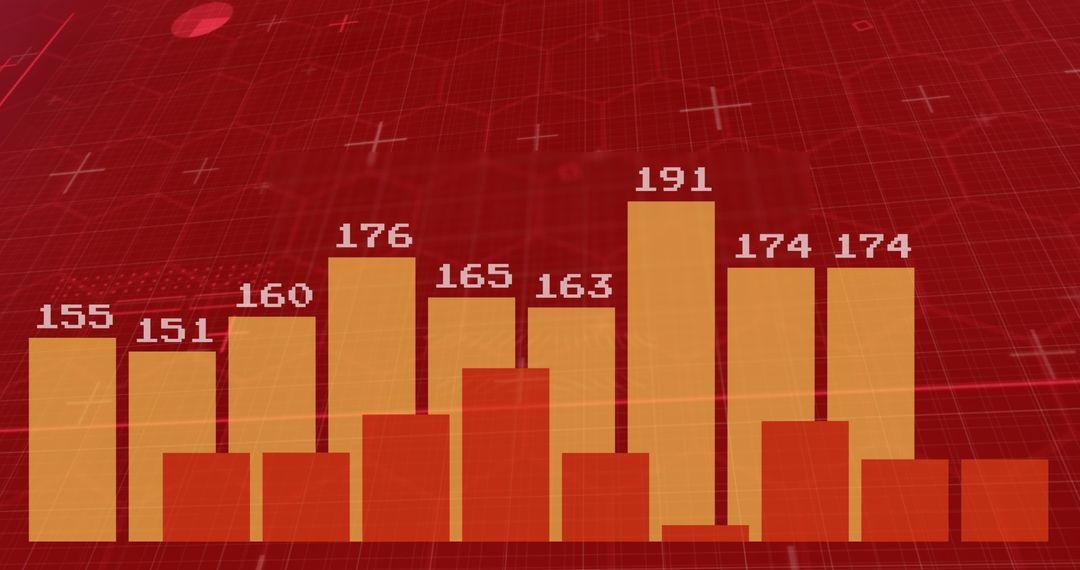
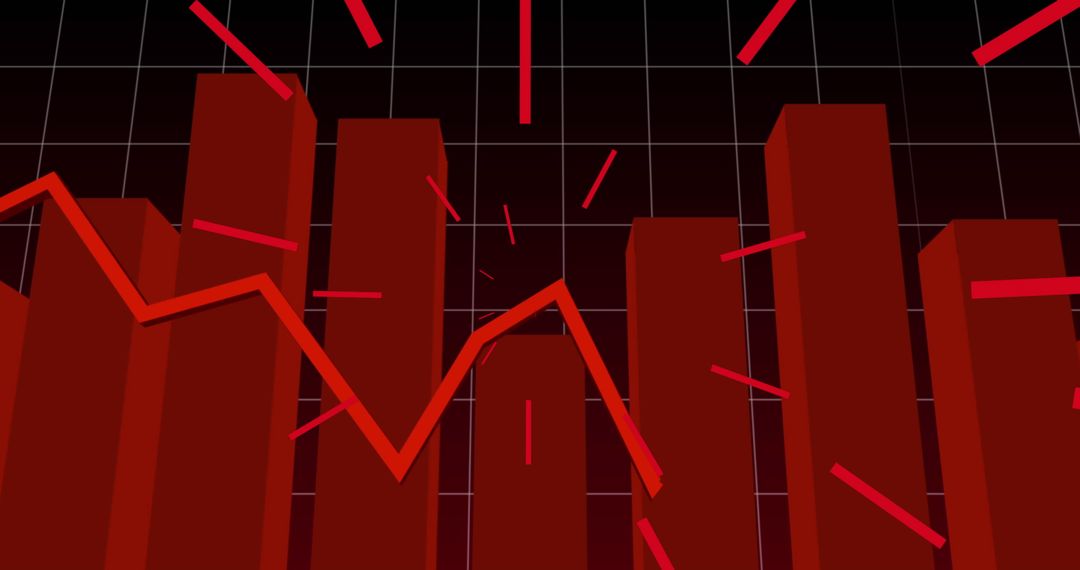
- Declining Financial Chart with Red Bars and Graph Line
Declining Financial Chart with Red Bars and Graph Line Image
Visual representation of a declining financial market with red bars and a line chart. Suitable for illustrating negative stock market trends, economic downturns, or financial analysis in business presentations and reports.
Powered by 


2
downloads
downloads
Tags:
More
Credit Photo
If you would like to credit the Photo, here are some ways you can do so
Text Link
photo Link
<span class="text-link">
<span>
<a target="_blank" href=https://pikwizard.com/photo/declining-financial-chart-with-red-bars-and-graph-line/b210e1042d768d19dee1e4436bf88347/>PikWizard</a>
</span>
</span>
<span class="image-link">
<span
style="margin: 0 0 20px 0; display: inline-block; vertical-align: middle; width: 100%;"
>
<a
target="_blank"
href="https://pikwizard.com/photo/declining-financial-chart-with-red-bars-and-graph-line/b210e1042d768d19dee1e4436bf88347/"
style="text-decoration: none; font-size: 10px; margin: 0;"
>
<img src="https://pikwizard.com/pw/medium/b210e1042d768d19dee1e4436bf88347.jpg" style="margin: 0; width: 100%;" alt="" />
<p style="font-size: 12px; margin: 0;">PikWizard</p>
</a>
</span>
</span>
Free (free of charge)
Free for personal and commercial use.
Author: Creative Art
Similar Free Stock Images

Premium


Premium


Premium


Premium


Premium


Premium


Premium


Premium


Premium


Premium


Premium


Premium


Premium


Premium


Premium


Premium


Premium


Premium


Premium


Premium


Premium


Premium


Premium


Premium