- Home >
- Stock Photos >
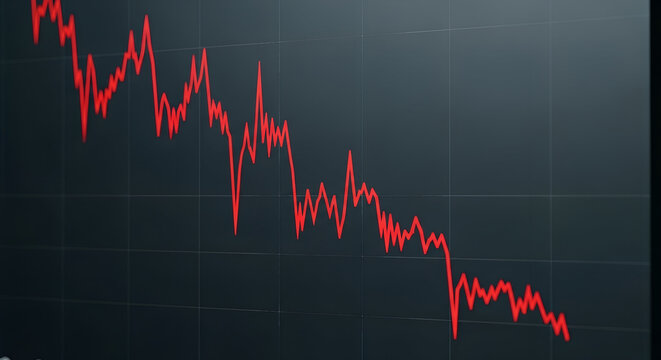
- Declining Financial Chart with Red Lines on Data Grid
Declining Financial Chart with Red Lines on Data Grid Image

Visual depicts red lines representing a downward trend on a dimly lit data grid, symbolizing a decline in financial performance or market value. Useful for illustrating themes of financial downturn, economic challenges, or market fluctuations in presentations or reports.
Powered by 


2
downloads
downloads
Tags:
More
Credit Photo
If you would like to credit the Photo, here are some ways you can do so
Text Link
photo Link
<span class="text-link">
<span>
<a target="_blank" href=https://pikwizard.com/photo/declining-financial-chart-with-red-lines-on-data-grid/1e2a343085d2217942fc41d9a2739f95/>PikWizard</a>
</span>
</span>
<span class="image-link">
<span
style="margin: 0 0 20px 0; display: inline-block; vertical-align: middle; width: 100%;"
>
<a
target="_blank"
href="https://pikwizard.com/photo/declining-financial-chart-with-red-lines-on-data-grid/1e2a343085d2217942fc41d9a2739f95/"
style="text-decoration: none; font-size: 10px; margin: 0;"
>
<img src="https://pikwizard.com/pw/medium/1e2a343085d2217942fc41d9a2739f95.jpg" style="margin: 0; width: 100%;" alt="" />
<p style="font-size: 12px; margin: 0;">PikWizard</p>
</a>
</span>
</span>
Free (free of charge)
Free for personal and commercial use.
Author: People Creations
Similar Free Stock Images

Premium


Premium


Premium


Premium


Premium


Premium


Premium


Premium


Premium


Premium


Premium


Premium


Premium


Premium


Premium


Premium


Premium


Premium


Premium


Premium


Premium


Premium


Premium


Premium